
This series unpacks the different types of analytics that exist and the best applications for each. Understanding these distinct varieties better equips us to operate successfully in the analytics space and navigate its cyclical nature effectively.
So far in this series, we’ve laid a foundation for the analytics conversation, and we’ve discussed descriptive, or type 2, analytics. Now, we’re going to dive deeper into how we can apply this in more advanced contexts.
The second type of analytics is all about building upon our descriptions of the world by looking for deeper patterns. We start seeking answers to more complex questions like:
- What items often sell together?
- How is our customer base changing?
- Why did sales go up last year?
Asking More Complex Questions
This type of analytics is fueled by curiosity and done with a combination of visualization and more complex statistics (like correlation analysis). The key here is trying to separate the signal from the noise. The world is random, and patterns emerge that aren’t relevant. Our sales went up when we spent more on marketing; does that mean marketing increased sales? Or did it happen because of the good economy?
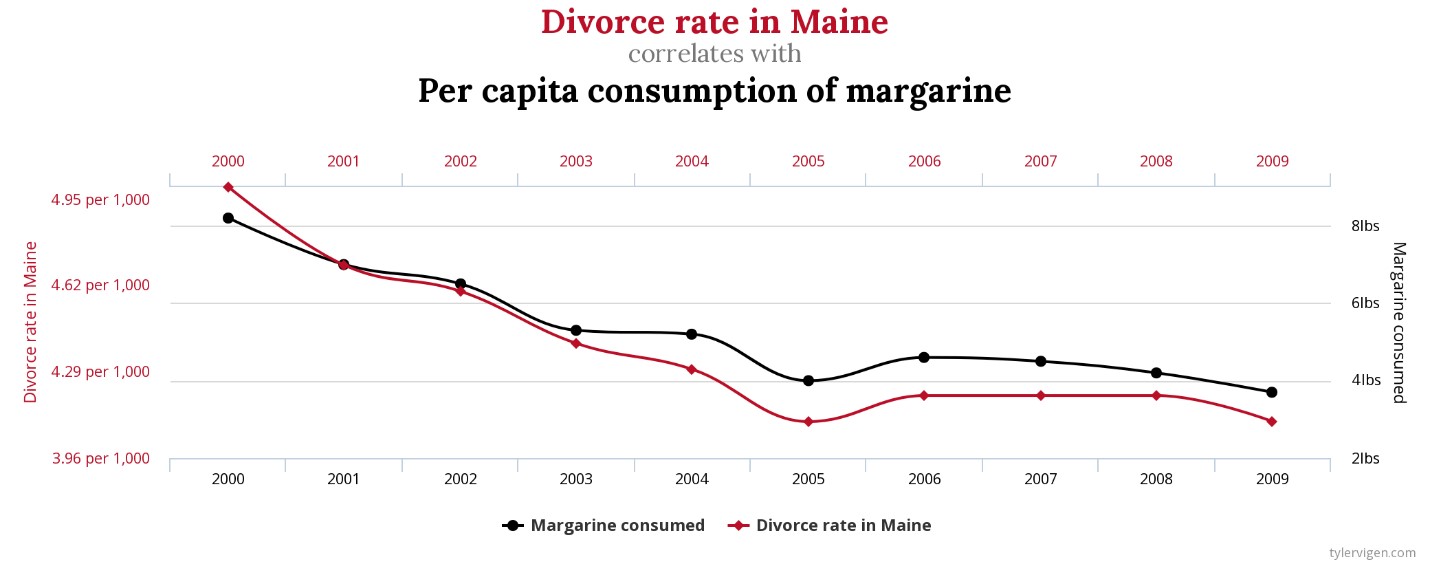
Tableau and Descriptive Analytics
Type 2 analytics is where analysts should spend the bulk of their time, exploring and interrogating their data. It’s essential that they don’t stop at the first answer they find but find the next question to answer. Ten years ago when I started with Tableau, it was its ability to open up this type that got me so excited. Its key innovation was helping us better understand our world through data by making it easier to see patterns and correlations.
As Tableau has matured as a product (and taken over the industry), it’s expanded upon that mission, making it easier to bring multiple data sources together and increasing the ease with which we can apply more advanced statistics. In short, it has made (and continues to make) taking the leap from type 1 analytics to type 2 easier than ever.
Putting Our Patterns to the Test
Once we start seeing our data and finding patterns, we need to take what we think we know and test it. You’ve probably heard that correlation doesn’t imply causation, so we must separate the randomness in our data from the actual true. This is where the science part of “data science” comes in.
We test what we think we know (our hypothesis) by creating experiments. Experiment design could be its own blog series, but it’s important to know that it doesn’t have to be complex—you can start simply by tracking your understanding over time. The important thing is to start testing assumptions and seeking facts that might contradict your understanding.
Maturity in this analytics type is along three dimensions:
- Ability to combine data from disparate sources
- Nuance of statistics used
- Proper experiment formation