
Recently, our own Dan Murray blogged about NFL Players and their arrests. This got me thinking about the risk of a newly drafted NFL Player being arrested, which of course also got me thinking about survival analysis. Wait. What did I just say?
Survival Analysis Explained
Survival analysis is most closely associated with medical and recidivism studies – think of it as analyzing the time to an event. In medical studies, it’s the time until someone dies. In prisoner recidivism studies, it’s the time until a former inmate returns to prison. Survival curves can help look at the risk facing a given population, and predictive models can even be built to estimate when an event will happen.
To keep things simple, I wanted to look at what the curve would look like for players drafted to the NFL. To do this, I took the data from Dan’s article and joined in some outside data on all NFL players. I brought in the outside data in order to get the entire population of NFL players – not just the ones who committed crimes. I limited the data to only players who have been drafted since 2000 as the arrest data only included arrests back to 2000.
Then, I looked at Kaplan-Meier curves. Kaplan-Meier curves are actually quite intuitive as they are plotted with the function:
KM(t) = Individuals Left at Time t / Total Individuals
Essentially, at any given time t, what is the % of individuals who have not had the event occur. In our case, it is the % of Drafted NFL Players who have not been arrested. Here is a quick look at some output from the Lifelines package in Python. Timeline is in years:
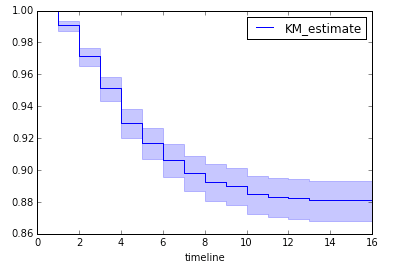
Looking at the chart, the blue line is the estimate with light blue confidence bands around the line. The bands get larger as we get further out in years as we have less data.
Looking at the curve for the entire population, about 93% of draftees have not been arrested within four years of being drafted – meaning 7% have. Interesting. But what about players with different backgrounds?
Does College Make a Difference?
Being the huge college football fan that I am (Go Nittany Lions and Wolfpack!), I wondered if the college program that the player was drafted out of mattered. One way to look at whether or not college is relevant is to plot two separate curves (one for players from a particular college and one for all other colleges). Here is an example using USC (Southern Cal):
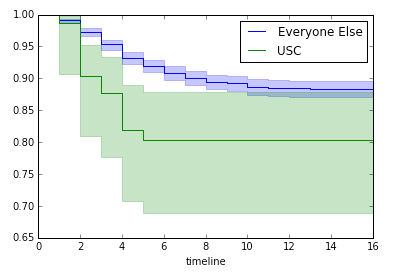
A little more interesting. But are these curves that different from one another? Well, we can measure this statistically with hypothesis testing! Using the LogRank test (since we’re comparing two curves – for those nerds out there), we can test if the difference between the curves is statistically significant. Sorry, Trojan fans – your curve is statistically different from the other colleges in aggregate.
Visualizing the Results in Tableau
To make this a little more entertaining than static images from Python, I thought I’d use Python Flask, a Postgres database and a Tableau dashboard to give you an interactive app to compare the curve of the college of your choice to all other colleges. Beware Trojans, Mountaineers, Terrapins and Cowboys.

While the NFL data is interesting for sports fans, this problem of analyzing time to an event is very common in the business world. How likely are my employees to leave in the next two years? Are certain groups of customers leaving at faster rates than others? There are many problems that involve analyzing events, and survival analysis is one way to approach it. Beyond survival curves, we can use hazard functions and regression models to help us not only look at the probability of an event but also get a prediction based on different factors. More on that at a later date …