EXASOL offers the world’s fastest in-memory analytic database. It is built from scratch to offer the highest performance and scalability for in-memory analytics. You can now build in-memory data analytics in less than 15 minutes. Forget about maintaining and investing on expensive analytical tools used for obtaining actionable insights.
Creating R Scripts in EXASOL
Many organizations now use R tool for customer segmentation, market basket analysis, etc. R offers a variety of analytical methods and easy to use built-in functions for data analysis and modeling. In EXASOL, you can build R scripts to perform analytics and there is no need to download data. Here is a simple example of performing a t test to find out if males significantly earn more than females.
You should specify the input parameters and output parameters. I need to pass income and gender (specific to example) to conduct a t test. Also, I want to see t-statistic, p-value and confidence interval for the difference in income means and will then designate these as output parameters. Now, let us create a data frame by looping through the input being passed. This is pretty much the replicate of how t test is done in R except for defining the function “run.”
OPEN SCHEMA RETAIL;

CREATE OR REPLACE R SET SCRIPT "TTEST" ("x" DOUBLE, "y" CHAR(100) UTF8) EMITS ("STATISTIC" DOUBLE, "PVALUE" DOUBLE, "CONF" DOUBLE) AS

run <- function(ctx) {

                                    # initialize then loop through input

                                    df <- c();

                                    ctx$next_row(NA)

                                    df <- data.frame(x = ctx$x, y = ctx$y)

                                    #calculate test statistics

                                    tt <- t.test(x~y,data=df)

                                    #emit interesting values from t-test

                                    ctx$emit(tt$statistic, tt$p.value, tt$conf.int)

}

/
Once the script is created, you should be able to call the script by passing values that are queried from the database.
select retail.ttest(income, sex)

from (select income, gender, case when gender = ‘F’ then ‘F’ else ‘M’ end sex from retail.rdemo)

where sex in (‘F’, ‘M’);
Oops! p-value is less than the significance value (0.05) which means that males do earn more than females. Analysis that can be performed using analytic tools can now be performed using EXASOL in-memory analytics. Data storage and analytics can now be done on a single tool which makes it easier to access data.

Creating Python Scripts in EXASOL
You can hand over Python scripts to the EXASOL, allow it to run on a data set and receive the result set quickly. Internally, UDF scripts are created and executed on the given tables and the results are transferred using a very fast bulk loading process. The below example retrieves data from XML and displays the results. Additionally, you can also store the results in the database using “create table statements.”
You should specify the input parameters and output parameters. For example, I want to see the name and price of the item while labeling these as output parameters. Now, let us open the URL and loop through the metadata to get the desired output.
OPEN SCHEMA RETAIL;

CREATE OR REPLACE PYTHON SCALAR SCRIPT "XMLDATA" ("url" VARCHAR(500) UTF8) EMITS ("NAME" VARCHAR(50) UTF8, "PRICE" VARCHAR(20) UTF8) AS

import re

import xml.etree.cElementTree as etree

from urllib2 import urlopen

def run(ctx):

                  content = etree.parse(urlopen(ctx.url))

                  for user in content.findall('food'):

                                    ctx.emit(user.find('name').text, user.find('price').text)

/
Once the script is created, you should call the script by passing the URL.
select retail.xmldata(‘https://www.w3schools.com/xml/simple.xml’)


from dual;
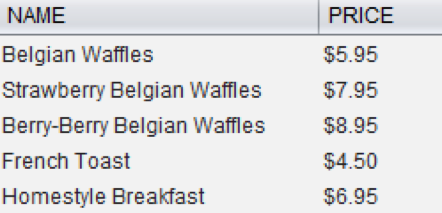
After the script is executed, you will get the output as shown below. Basically, it is retrieving the information that I need from the given URL.

Nowadays, many projects require scrapping data from social media sites. Using this method you can pull tons of data from API’s and store it directly on an EXASOL database. All you have to do is change the metadata structure according to JSON/ API.

