
This blog post is Human-Centered Content: Written by humans for humans.
Sigma’s introduction of Single-Select and Multi-Select column types has opened up a new level of table customization. Pills, also known as chips or badges, help viewers instantly categorize data by taking advantage of pre-attentive attributes of shape and color. Additionally, pills can help break up visual monotony in large tables without creating as much visual noise as conditional formatting.
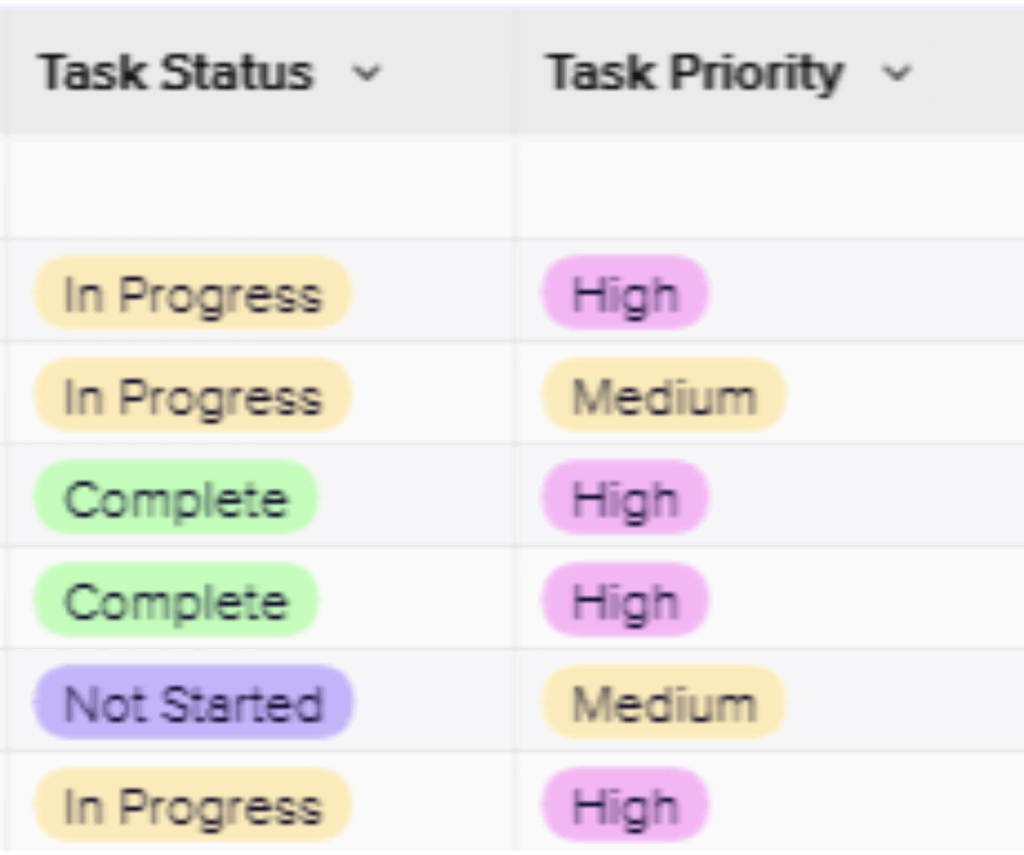
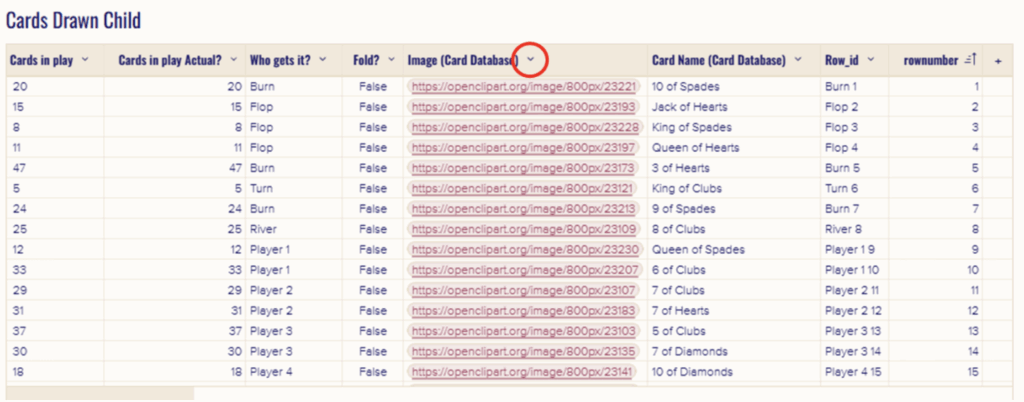
Above: Two Single Select columns which benefit from increased formatting options in a Sigma table
However, in Sigma columns that come directly from your data source can’t have their type changed to Single Select, meaning they also can’t be formatted as pills. That limitation leaves a gap — you can’t style your warehouse data using Sigma’s sleek pill format.
Additionally, while calculation columns are powerful, complex ones (especially those that call back to your warehouse) can slow down your workbook since Sigma recalculates them frequently. Fortunately, there’s a workaround that addresses both issues.
There are two ways to create pills in your Sigma table, each with their own advantages and alternative use cases.
Which Option Should You Choose?
Both approaches can create pill-like visualizations, but they serve different needs:
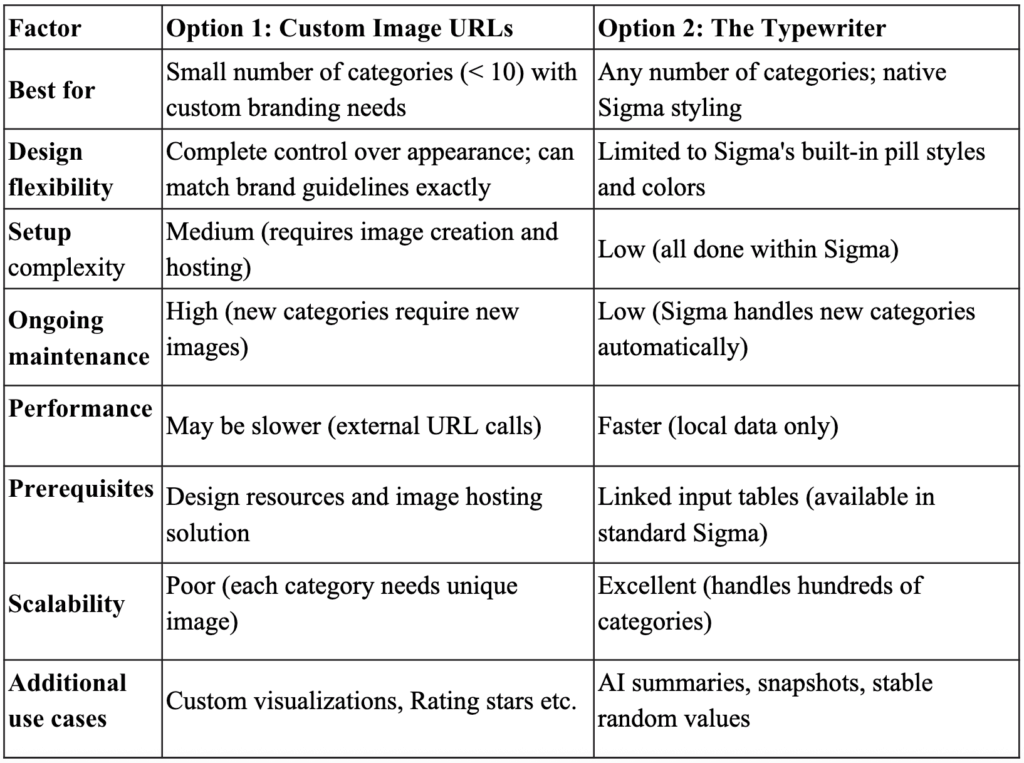
Quick Decision Guide:
Choose Option 1 if: You have a design team, need pixel-perfect brand alignment, have fewer than 10 static categories or want to explore advanced custom visualizations like embedded d3 elements.
Choose Option 2 if: You want a quick solution, have many categories, need flexibility for future changes, lack design resources or want to leverage the technique for other optimization use cases beyond pills.
Feel free to jump to the option that fits your needs.
Option 1: Custom Image URLs
Custom images in table columns are a powerful tool. A text column filled with image URL endpoints can be formatted to display the images instead of the text of the URL. Here is how it works:
1. Whip up some custom images of the options you would like.
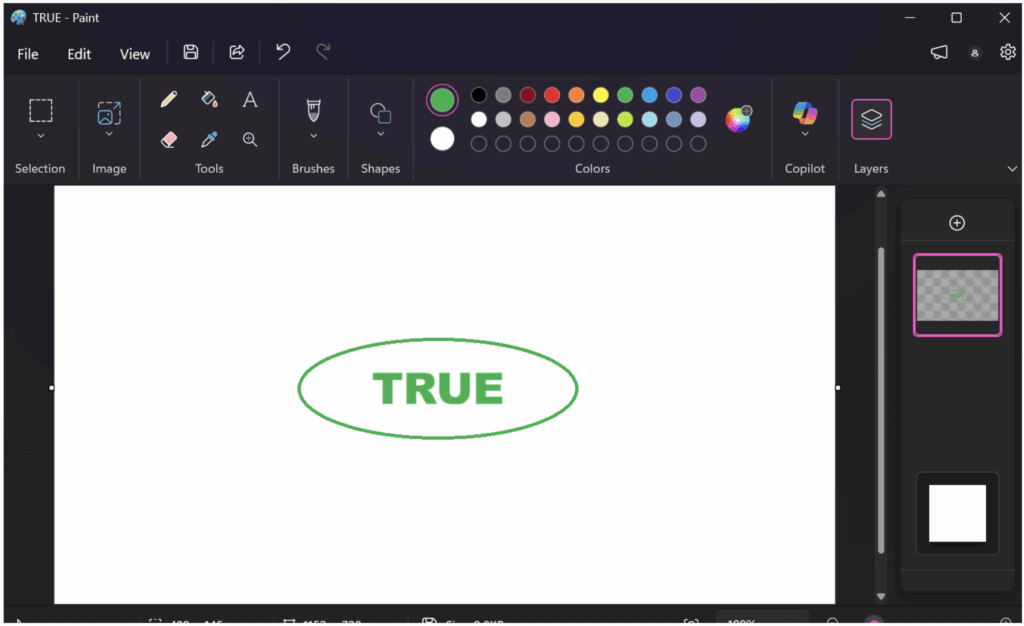
Above: I made these True/False badge pngs quickly in paint.
2. Host them to a URL if you only have a few images, you can use a website like https://www.image2url.com/ to host the image for you.


 Above: Copy the image URL provided. This is what you will use to display the image in Sigma.
For enterprise deployments, you’ll want more reliable hosting than free services. Here are the most common enterprise options and how to configure them for Sigma:
Google Drive:
Share the image and copy the link. Make sure that the share is set to public with viewer level access:

The link will be in the following format:
https://drive.google.com/file/d/[FILE_ID]/view
Cut out the File ID and paste it into the:
https://lh3.googleusercontent.com/d/[FILE_ID
Box:
Share the image and copy the link.
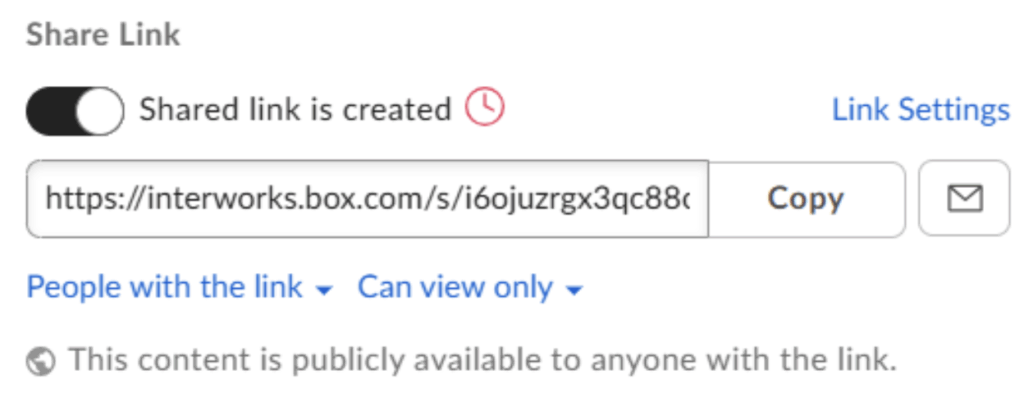
The link will be in the following format:
https://[company].box.com/s/[shareid]
Change the format to:
https://[company].box.com/shared/static/[shareid].png
Important Note: As of now, Google Drive links are unreliable for embedding in Sigma due to
cross-origin restrictions. While the lh3.googleusercontent.com format sometimes works,
it’s undocumented and may fail without warning. For production use, prefer Box or AWS S3.
OneDrive and AWS S3 are also viable options. Contact your IT team for help setting up these enterprise hosting solutions. Now, back to the pills.
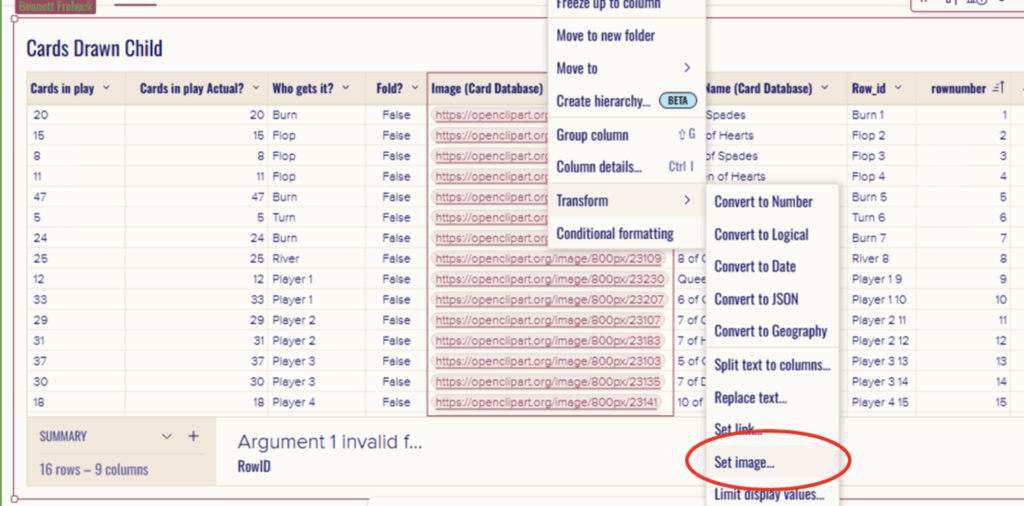
3. Use a switch statement to point to the correct image given the column you would like formatted as a pill. 
4. To make the column display the image instead of text right click on the column header or select the carat. Then select “Set image” under “Transform.”
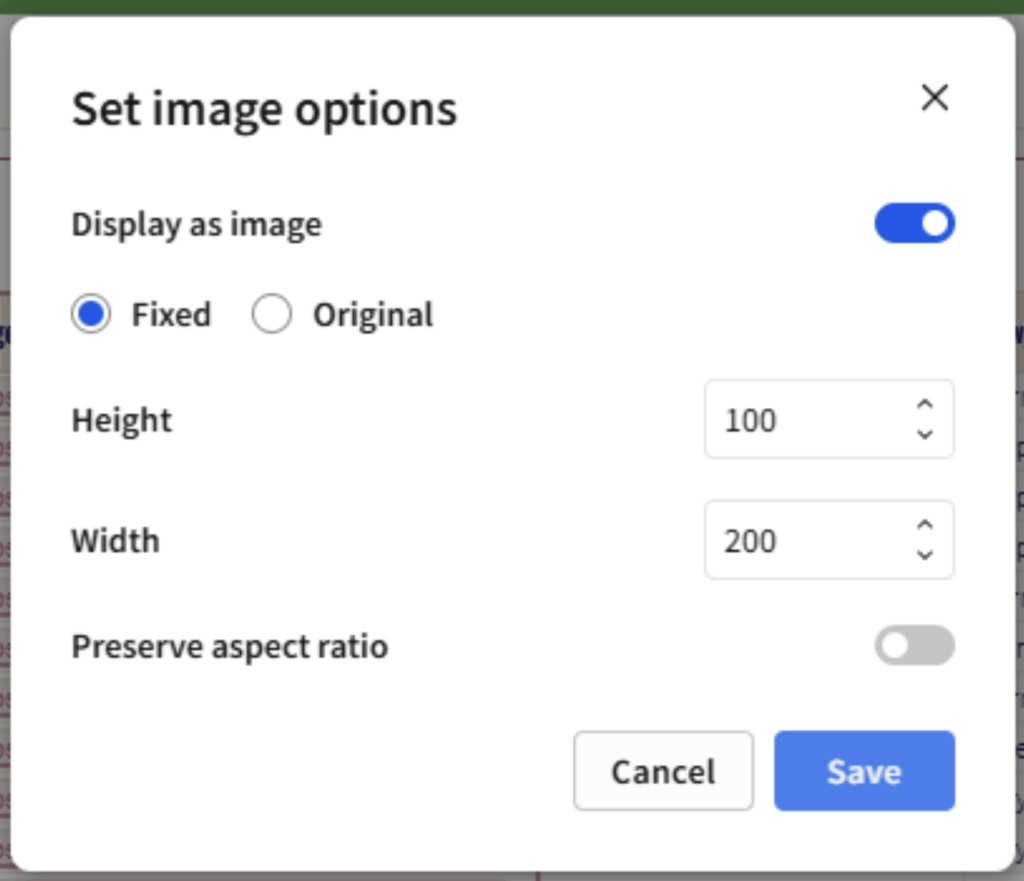
Above: You can customize the image appearance here. The important thing is to click “Save” When you are finished.
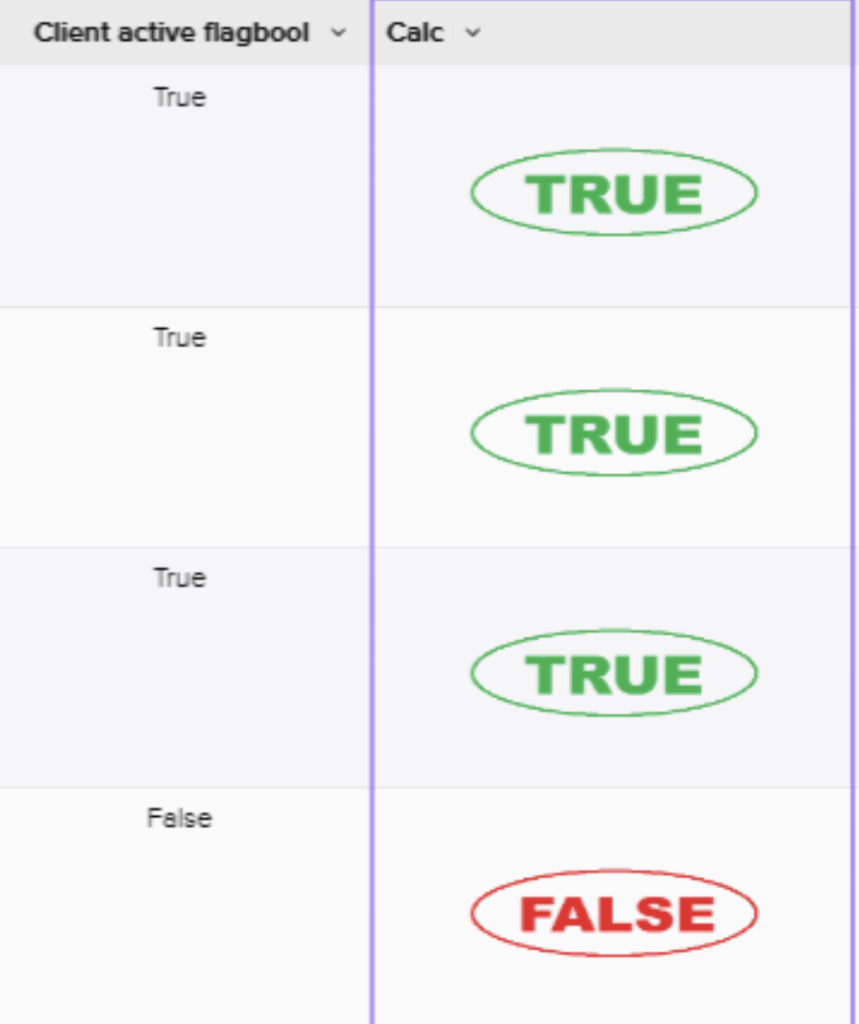
Once you save the image settings the image will appear in your table:
 Some other use cases for this would include custom visualizations such as stars for product reviews, batteries to denote charge percents or hearts to indicate health. Any image your team can create can be embedded dynamically in a table in Sigma.
This approach can lead to some beautiful results but will fall apart if you do not have someone to create custom images for you consistently or if you have too many categories to make and host all the images. Additionally, this method may be slightly less performant in some cases as Sigma needs to hit and return the image URL.
More advanced developers may be able to see even more use cases for this methodology such as custom d3 plugins embedded into a table creating a fully customized table. However, the details of that application are out of scope for this blog.
Option 2: The Typewriter
This technique uses a linked input table and a button to copy values from a warehouse column into an input column, which you can then turn into pills.
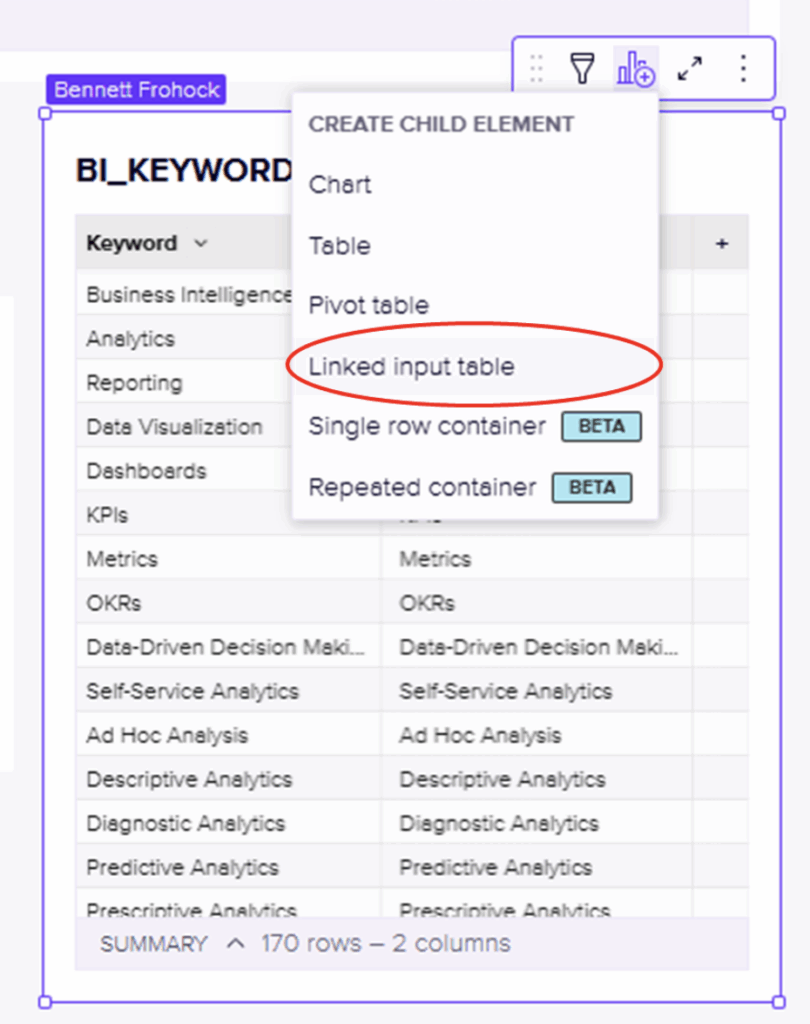
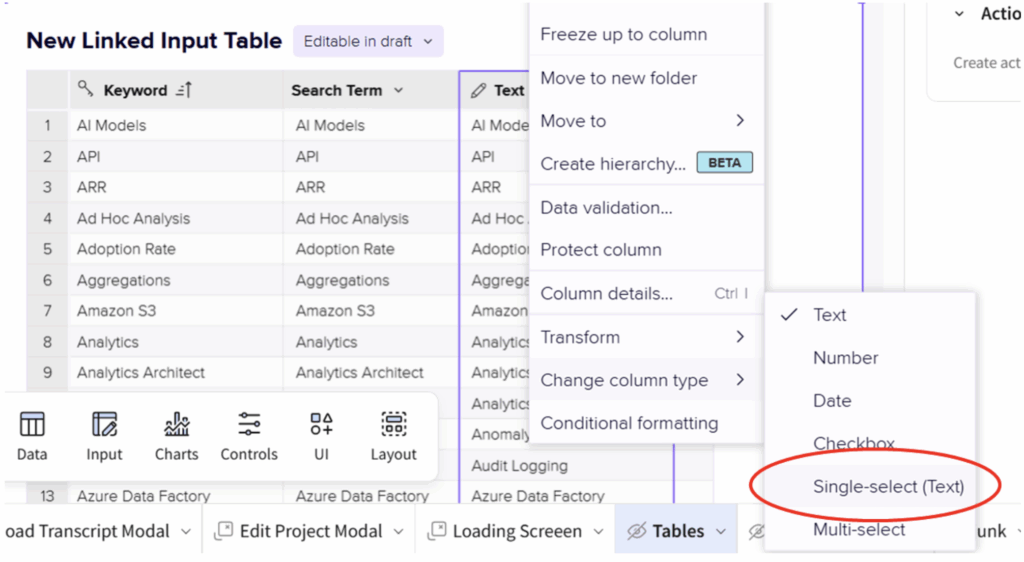
1. Create a linked input table
From your warehouse-backed table element, create a linked input table so you have a writable version of the data. Then select which columns you want to include in the new table:
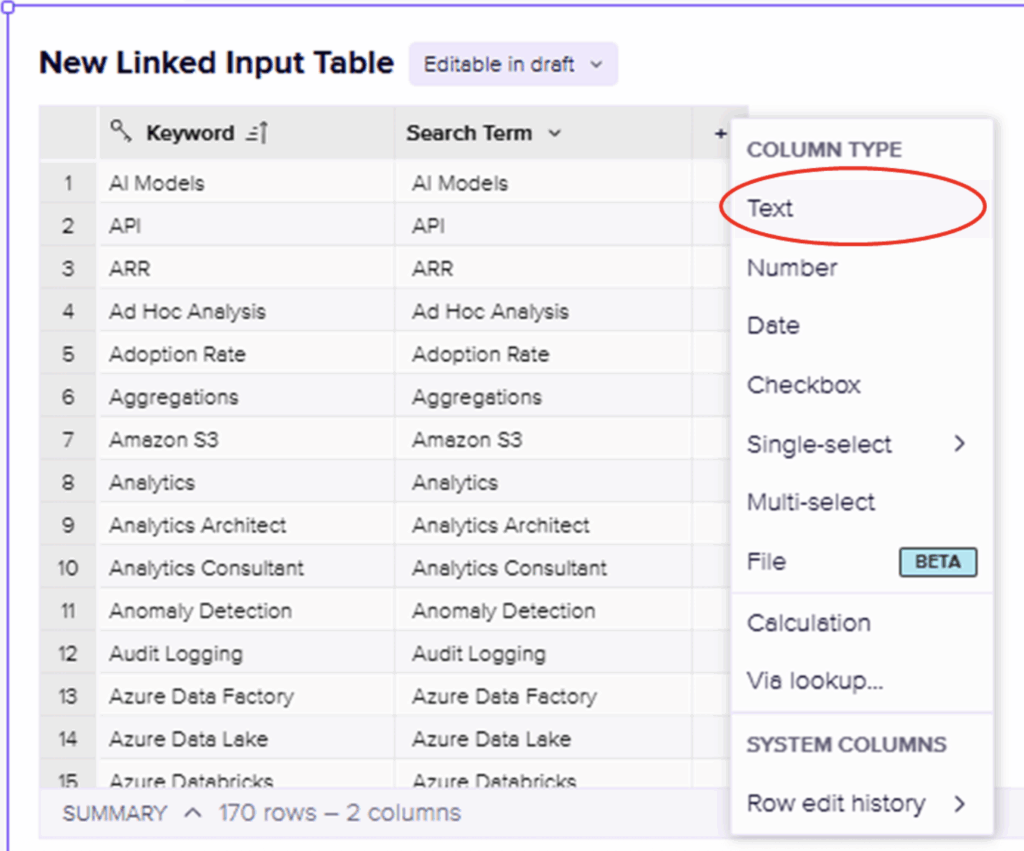
 2. Add a new text column
In the linked input table, add a new text column (for example, Pill Status) that will hold the copied values:
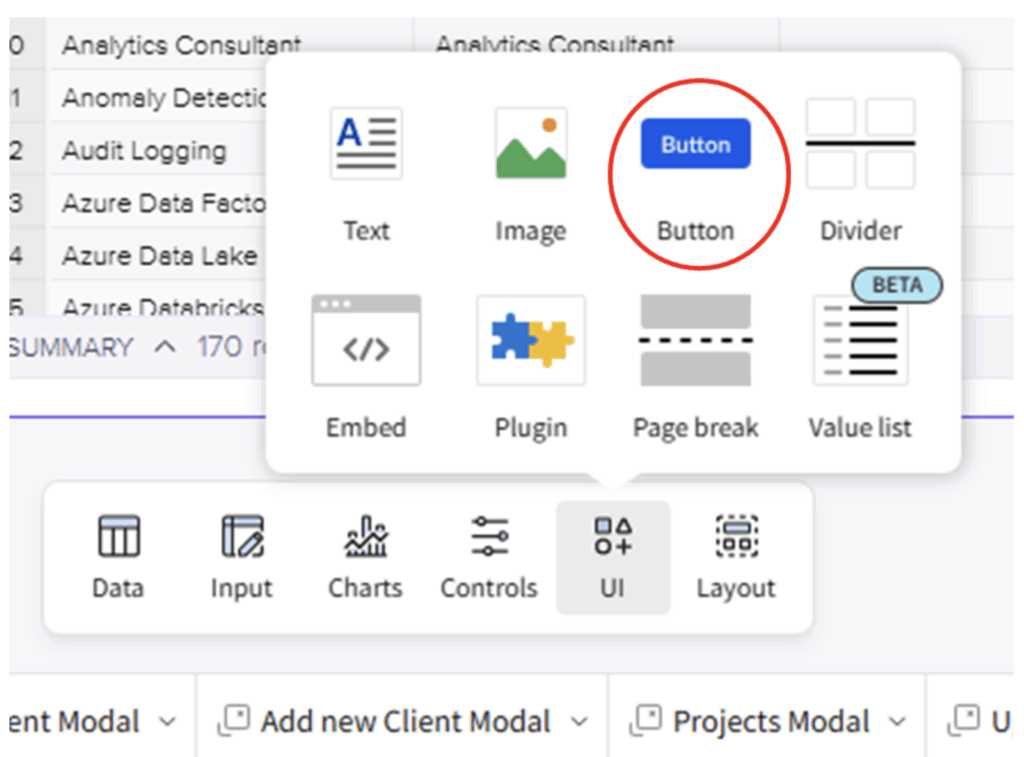
 3. Add a button with an Update Rows action
Drop a button element onto the page, then add an action to it that updates rows in your linked input table:
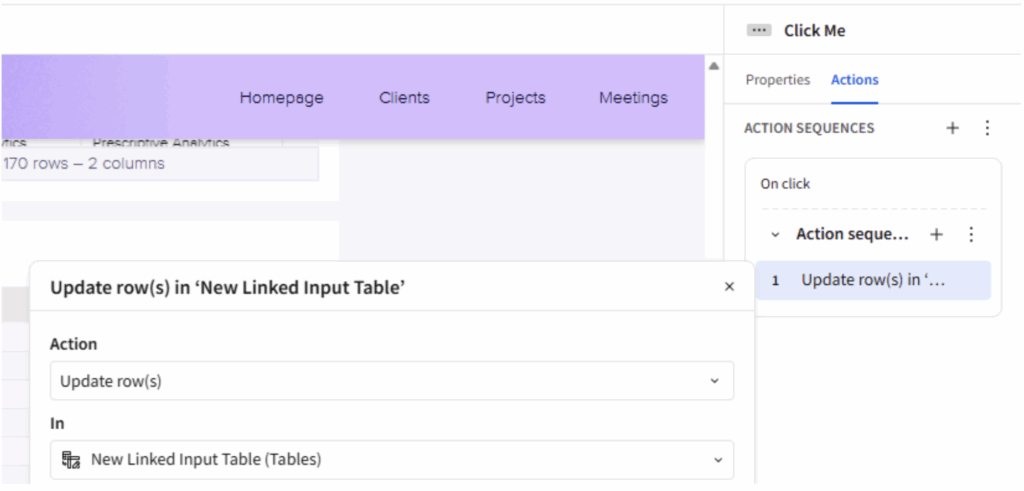
4. Set which rows to update
Configure the action to update any rows where your ID column is not null, so it runs across all actual rows.
5. Copy the source column into the new column
In the same action, set the new text column’s value to equal the warehouse column you want to display in a pill-like format.
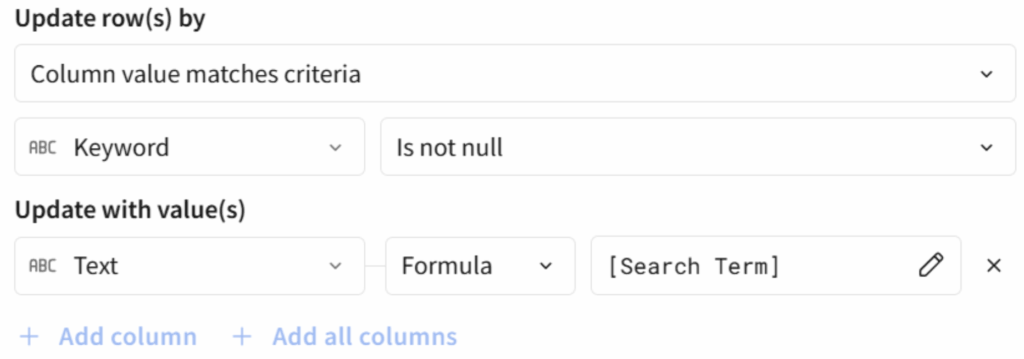
Above: Replace these with the columns in your dataset Keyword should be the ID column, Text is the display column the one that will hold the pills, and Search Term will be the original column you want to copy.
6. Run the button and convert to Single Select
Click the button once to fill the new column, then change that column’s type to Single Select and style the pills however you like.
 7. Finally, customize the appearance of the single select column
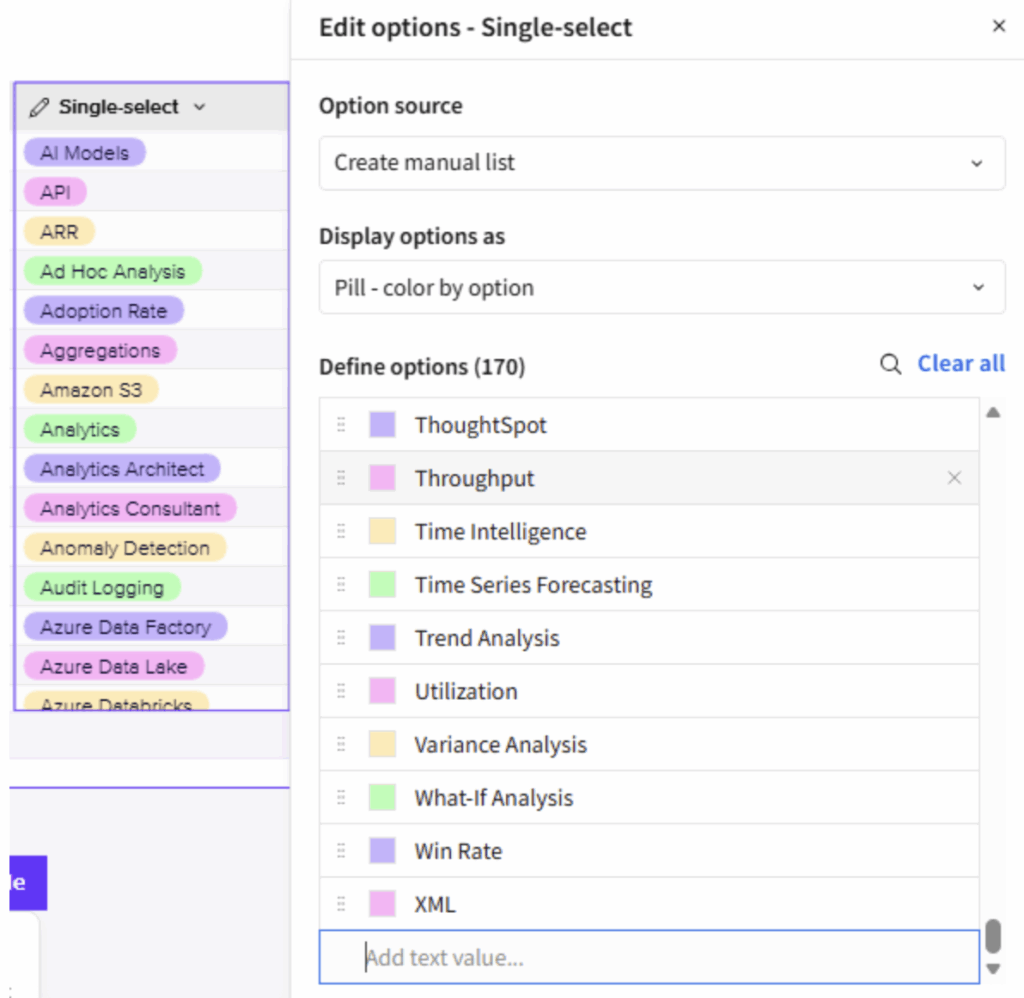
Above: Here, 170 unique categories have been added to the options for pills. They can be customized by color individually.
Now, by using the Typewriter you have created a pill appearance for a column that was previously unpillable. The downside is that, as your data refreshes, your pilled column will not. At least not automatically. Once configured, this action can be copied onto any element, allowing users to refresh the input column automatically without realizing it’s happening behind the scenes. And it’s not limited to pills — input columns are generally more flexible in formatting and behavior.
Additionally, you can refine the update condition to save on compute costs — for example, update only rows where the Input column differs from the source column, or put the action sequence behind a condition entirely.
The Typewriter works by filling a new input column with copies of each row’s values rather than duplicating the entire row. The trade-off is a bit more storage in your input table, but in return you gain predictable behavior and can often cut down on repeated compute.
Use a formula instead of a simple field and you open up even more possibilities for the technique.
Here are a few ways to put The Typewriter to work beyond styling pills:
- AI summaries on demand
Instead of calling an AI function every time the workbook refreshes, you can generate summaries once, write them into an input column, and then refresh them only when a user clicks the button or when specific conditions are met. This keeps AI usage (and cost) under control while still giving users rich, descriptive fields. - Static or “snapshot” fields
If you need to populate dummy data for demos, freeze a particular state of your data, or capture a one-time snapshot (like a status at month-end), The Typewriter lets you fill and hold those values in an input column without worrying about future refreshes changing them. - Stable random values per row
Many random or pseudo-random expressions will recalculate on each refresh, which can be confusing for users and expensive for your warehouse. With The Typewriter, you can generate a random value once per row, store it in an input column, and keep it stable unless you intentionally regenerate it with the button.
For example, only update an AI summary of a project if there is an update to the project data. Save a sample dataset and the results it produced from a ML model. Create random, persistent groups for AB testing. Use the technique multiple times in an app to create something truly powerful.
Consider building a customer success dashboard that combines multiple The Typewriter applications in a single, performant app:
The App Components:
- Health Score Pills (Basic The Typewriter for pills)
- Warehouse columns contain customer health scores: “At Risk,” “Stable,” “Growing,” “Champion.”
- The Typewriter copies these into an input column formatted as color-coded pills.
- Users can manually refresh when new health scores are calculated monthly.
- AI-Powered Account Summaries (Conditional AI execution)
- An input column stores AI-generated summaries of each customer’s recent activity.
- The button updates summaries only when [Last Activity Date] > [Summary Generated Date]
- Prevents expensive AI calls on every refresh; summaries regenerate only when customer data actually changes.
- Baseline Annual Recurring Revenue Snapshots (Static snapshot fields)
- Captures each customer’s ARR at quarter start in an input column.
- Updated only on first day of quarter via conditional button action: Today() = QuarterStart()
- Enables accurate growth calculations throughout the quarter without complex date logic.
- Persistent A/B Test Groups (Stable random values)
- Assigns customers to test cohorts (A/B/Control) using a random function.
- The Typewriter writes these assignments once to an input column.
- Test groups remain stable across refreshes, ensuring valid experiment results.
- Regenerate only when starting a new test campaign.
The Implementation:
A single button labeled “Refresh Dashboard Data” contains multiple update actions:
- Always: Update health score pills from warehouse.
- Conditional: Refresh AI summaries only for accounts with new activity.
- Date-based: Capture new quarterly ARR snapshots on quarter boundaries.
- Manual: Include a separate “Reset Test Groups” button for occasional use.
The Payoff:
Instead of hitting the warehouse with AI functions, complex date calculations and random generators on every page load, this dashboard executes expensive operations only when needed. The result is a reduced load time, controlled costs and a professional appearance — all while giving Customer Success Managers the rich insights they need
Whether you choose custom image URLs for pixel-perfect branding or The Typewriter for native flexibility and performance optimization, you now have proven techniques to unlock better table visualization in Sigma. Custom images deliver complete creative control when design is paramount, while The Typewriter reduces compute costs and gives you control over when expensive logic runs — creating faster, more flexible data apps that still deliver rich insights to your users.
If you want help designing or implementing patterns like this in your own Sigma environment, InterWorks can partner with you to plan, build and optimize your next wave of data apps.