
Starting my internship at InterWorks, I was introduced to Sigma – a cloud-based analytics platform that promised to revolutionize the way I approached data. However, I wasn’t prepared for what I was about to discover. From its seamless integration with various data sources to its dynamic visualization options, Sigma offered a range of features that immediately caught my attention. In this post, I’ll walk you through the main elements that compose a Sigma Data App. This, in my opinion, breaks the mold of the industry and is setting a new standard in terms of the benefits it offers.
First Impressions with Sigma
Before delving into my impressions, let’s put this experience in context. I came into the data science world with previous experience in coding, both for desktop and web environments. However, when it comes to business intelligence visualizations, Power BI was my main reference.
That being said, when I watched an introductory video from Sigma’s website, it ignited a spark in my mind. I found a tool with improved capabilities for business intelligence visualization; and besides, it resembled the features I was used to expect from an integrated development environment! (Yes, I know my words fall short of truly expressing all the interesting features Sigma is putting in the hands of its customers. But do not rush to judge me so harshly. Remember, I am just giving the first impressions from a novice’s perspective).
The Concept of Data Apps in Sigma
To be honest, this was Sigma’s feature that caught my attention right away. You might be wondering: Do you mean dashboards that not only visualize information but also allow users to enter data and see updates in real time? Yes, exactly, and it makes perfect sense. But don’t let the term data app throw you off like it did for me. You might imagine data apps as a separate component or module inside of Sigma’s development environment but that’s not the case.
Data Apps are specifically designed solutions that link directly to your data platform, enabling the smooth integration of real-time data, workflows and user inputs. In turn, these apps are underpinned by three other remarkable attributes that Sigma can proudly boast about: input tables, layout elements and actions.
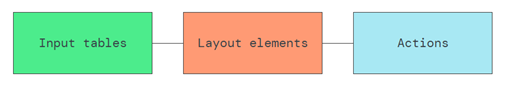
Screenshot 1: What makes a data app?
Source: https://help.sigmacomputing.com/docs/data-apps
Input Tables
Now you can see why Sigma immediately reminded me of my previous coding experience. Anyone who has ever developed before knows that you need to build interfaces that allow end users to enter new records into the systems.
That is why input tables, with their write-back features, felt intuitive to me. It was similar to the bi-directional data applications I used to build, although the approach in Sigma is slightly different.
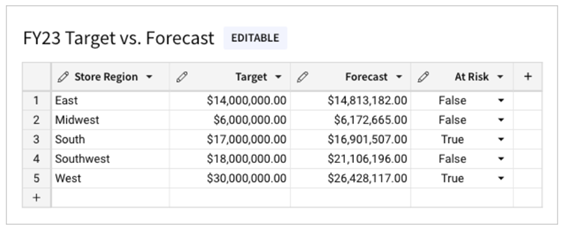
Screenshot 2: Sample Input Table.
Source: https://help.sigmacomputing.com/docs/intro-to-input-tables
Sigma gives us the ability to enter data back to the cloud through a spreadsheet-like interface, making the experience seamless. The advantages are clear: input tables support structured data entry, allowing you to incorporate new data points into your analysis and enhance existing data from your data platform. This facilitates rapid prototyping, advanced modeling, forecasting and more – all without altering your original data. This separation is crucial for maintaining the integrity of source data while enabling dynamic analysis and scenario planning.
Input tables are cool; but as if that weren’t enough, Sigma offers far more objects (controls to be precise) that ease the data entry process. However, if you want to dig deeper into what it’s like to build your first input table, I suggest you stay tuned for my blog. I am working on another post where I will walk you through everything – from A to Z – that I wish someone had told me before attempting to build my first linked input table.
Layout Elements
Let’s now devote to the second and third boxes that make the data app: layout elements and actions. These two are very connected to each other.
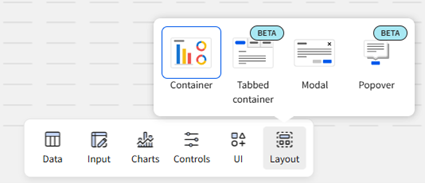
Screenshot 3: The Add Element Bar with the Layout menu displayed.
As of today, there are four objects available, two of which are still in beta.
Using development environments with predefined objects that can be easily dragged and dropped in a form or canvas has long been the standard approach to building interfaces. In this very same vein, the layout elements Sigma offers equip you with the tools to create clean, user-friendly interfaces.
You’ll find the essential components, like containers for grouping elements, that are common across most modern platforms. In addition, Sigma provides tabbed containers (currently in beta), which already perform quite well. However, a couple of components stand out that I want to draw your attention to: modals and popovers. These two container elements make workbook design simpler, creating an experience that resembles the behavior of a desktop app.
On the one hand, there are the modals that, when called, they overlay and obscure the workbook page, which enables a focused view of its content. At the same time, that enhances visual organization and facilitates the presentation of form fields, customized drilldowns, controls and filters within a dedicated container.
On the other hand, there are the popovers which are basically floating containers. Popovers are suggested to display extra, or more accurately, contextual information like filters, tables or charts but anchored to specific trigger buttons.
Notice the difference between both options. Modals are more elaborated containers that can have a header, close icon and action buttons. They are fully configurable for performing actions and very useful when it comes to creating auxiliary forms for complementary actions like inserting, deleting or updating records. Popovers, on the contrary, do not provide those customization options because they are basic containers that open on demand to display a central message or piece of data.
Overall, containers and modals enhance the delivery of information by enabling the organization of the data, streamlining workflows and highlighting insights precisely in the places where the user needs them. By using layout elements, you can facilitate efficient data input and detailed analysis, free from the distractions of unnecessary clutter.
Actions
If you’ve maintained a stiff upper lip until now, I hope this final, fun feature makes you eager to give it a try. When we refer to actions in Sigma, we mean interactivities we can configure across all workbook elements. This suggests that instead of having static dashboards you can automate responses to specific triggers to make them more interactional and, in my opinion, more useful for the end user.
For those readers with some programming background like me, actions are Sigma’s version of the old Event Handlers like: OnClick, OnHover, Mousehover and so on. However, in this case, Sigma offers an improved version that allows us to evaluate conditions prior to the trigger of each action.
All in all, the structure of an Action includes a condition, a trigger and an effect. Conditions are rules that determine when to execute or not execute the actions. The trigger is the expected user interaction, and the effect is the defined response. The drill is simple: You pick a control and set the conditions it needs to meet to allow the trigger to execute the desired effects.
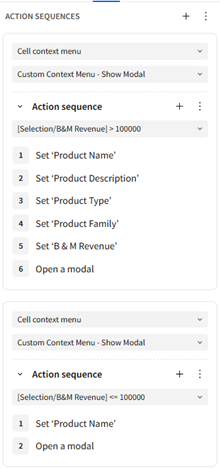
Screenshot 4: Configuration of a sequence of Actions for a Data Table.
Take a look at Screenshot 4. In this case I configured two actions to trigger when the user picks one specific option from the Context Menu. In this case, I had already added an extra entry to the context menu the data table displays when we right-click over it. (How to do it necessarily will need to be covered in a further post). Then, the first sequence only occurs when we pick that option from the Context Menu and the value of the column “B&M Revenue” in the selected row is over $100,000. The second action configured is basically, the alternative case, I mean when the value of “B&M Revenue” is under $100,000.
Notice the sequence of steps: validation of the condition, filling in the values in the target modal container and finally opening it. That’s it. The next recording displayed below showcases the results of the aforementioned stream of actions.
If you want to check the number of actions and triggers available, I suggest you give a read to Intro to actions from Sigma’s documentation site. You will see the number of actions and triggers available depending on the type of control you pick to work with.
The fact that Sigma had decided to include actions to its components, in my opinion, opens the door to a myriad of interactions that improve its capabilities and hence the end-user experience. That, by far, compensate for any weak spots in its development environment some users might find.
Final Thoughts on Sigma Functionality
I originally planned to cover more aspects of Sigma in this blog, but it ended up longer than expected. That said, there are still several features that deserve their own post. Sigma’s client-focused customizations, along with its robust data management and preparation tools, were also major factors in what got me hooked
Still, I guess you have already gotten a solid overview of the key elements that make up a Sigma data app. One thing to keep in mind is that Sigma’s data apps feature is a new approach to building dashboards that are powered by a set of controls and capabilities that Sigma puts directly in our hands. Whether we choose to use it or not it is up to us, but it’s easy to underuse Sigma if we continue with traditional methods and overlook these powerful features.
Keep in mind Sigma’s slogan: “Sigma is here to redefine BI. Forget the past 20 years of BI.” I would add: “Move Forward!”