This article reflects on my attempt at transforming a previously created Tableau dashboard. This transformation was greatly influenced by the insights gained from the excellent two-week Tableau data visualization training provided to me as a BI intern at InterWorks.
Most humans are visual creatures. We consume knowledge better when it is presented in a visually exciting but intuitive manner. The latter is the prime focus when the translation of data must result into actionable insights. But how does one define “intuitive?” This word is so subjective, especially in a business setting. The following before-and-after comparison might be able to answer that to a certain extent.
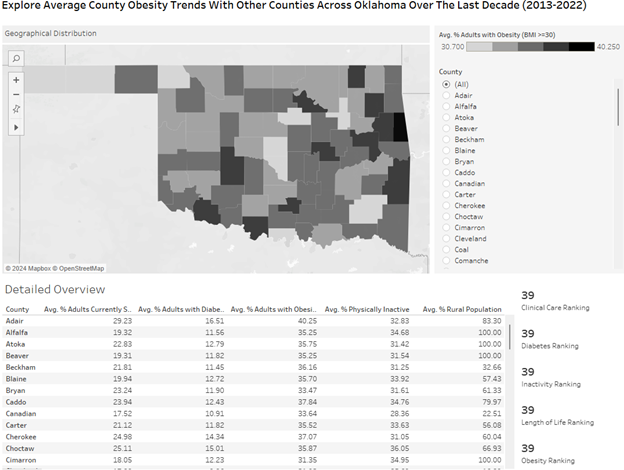
The Tableau Dashboard Before
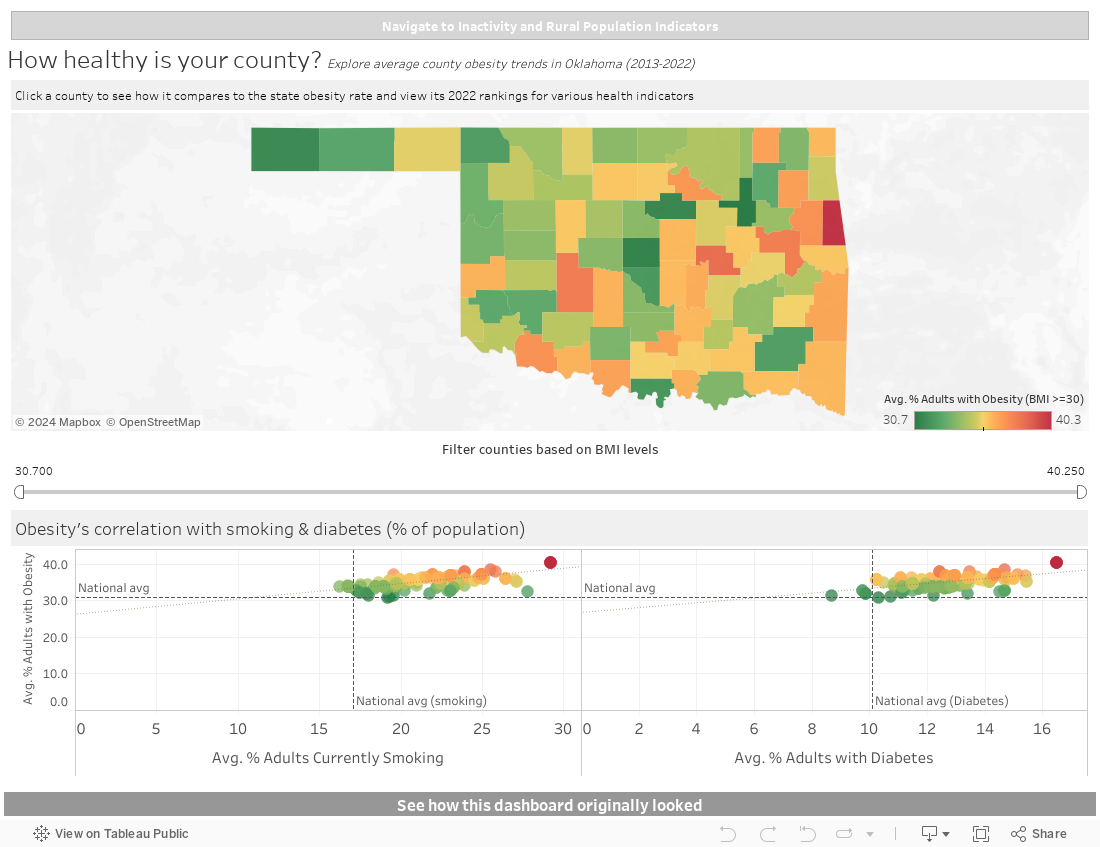
The Tableau Dashboard After
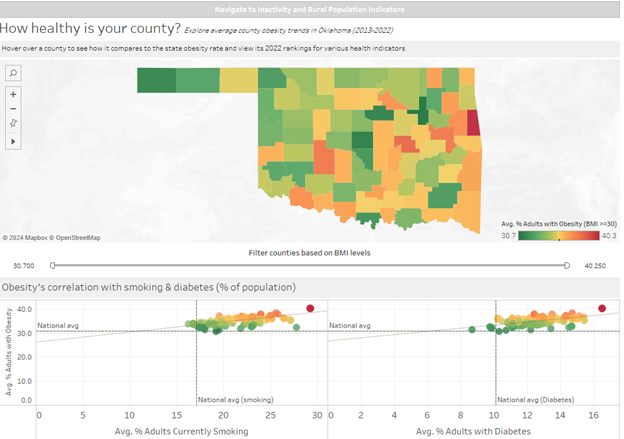
- Assigning context to the visualization — Both dashboards present information about the obesity trends in counties across Oklahoma; however, one assigns some context to it to help create a narrative. The is done through articulating the problem statement: “How healthy is your county?” This is a small adjustment, but it prepares the audience to absorb the information in the intended way.
- Making it intuitive — The monotonous black and white color scheme gives way to a more divergent palette. This new color scheme automatically helps in demarcating counties/regions based on the obesity levels of their population. It should be noted, however, that the red to green color scheme can provide issues for colorblind users, so that’s something to keep in mind when designing for an audience.
- Making it interactive — Assigning interactive components is a powerful way to enhance your visual and drive a narrative. For example, a single checkbox to filter counties, as seen in the first dashboard, provides information but lacks any narrative. By grouping counties with similar BMI levels, policymakers might effectively identify and focus on the counties that need attention. This approach highlights regional, geographical or socio-economic characteristics that may be influencing BMI levels, offering a more comprehensive understanding of the data.
- Additional value —A person’s BMI level is greatly influenced by certain lifestyle choices. The data provides hints at this by giving us various parameters, but the second dashboard solidifies that narrative using a scatterplot that showcases the linear dependency between these parameters. Adding a “National Average” reference line also helps to understand how individual counties are performing against the rest of the country, providing a useful benchmark. This helps end users gain additional insights that were previously hidden within the myriad of dull rows and columns.
For the unimpressed, these may seem like small tweaks, but they make a significant impact when the two dashboards are viewed in isolation. And for the overwhelmed, I only started to consciously consider these changes after listening to the experts at InterWorks, who do this day in and day out.
Looking forward to tweaking some of my other Tableau dashboards using these newfound skills and discovering more hidden narratives! In the meantime, you can explore this Tableau dashboard interactively below: