
For anyone interested in learning multiple BI tools, it’s always a rough start in the beginning: we’re sure we know the basics, but we also need to understand how some concepts translate or don’t even compare.
Like a Mac user trying to use a PC, switching between Tableau and Power BI can be frustrating if you don’t understand the basics. While all the concepts don’t translate 1:1, in this article, we’ll cover core terminology to help you see how each tool handles fields and calculations.
Tableau: Measures, Dimensions and Calculated Fields
A quick recap of what we know about fields in Tableau:
Measures are numeric variables used to represent data such as sales, profit or quantity. These are variables that can be aggregated using mathematical functions like sum, average, minimum, maximum or count.
Dimensions are qualitative data that provide context and describe the measures, think something like product category, region or time period. They are used to segment and categorize data, impacting how data is displayed and analysed in Tableau.
It’s the relationship between the two that allows us to create insightful visuals. Measures provide the numerical data, while dimensions add context. It’s highly unlikely that we will achieve a deeper analysis by using just the fields from our original data source. We’ll want to create custom fields like profit ratio, what-if analyses, forecasts and more.
Calculated fields in Tableau allow us to do just that, create new data from existing data fields by applying mathematical, logical or string functions. They can be used to perform operations on data, such as calculating ratios, differences or aggregations, and can be based on both dimensions and measures. Important to note is that underlying data is unaffected, we’re creating new columns in our dataset.
There are 3 types of calculated fields in Tableau:
- Basic (row-level and aggregate)
- Level-of-detail expressions
- Table calculations
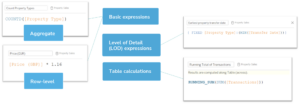
To create any of the above, we use functions, not dissimilar to those you might know from Excel. See below the calculated field editor in Tableau for example syntax:
Power BI: DAX, Calculated Columns and Measures
As we will see, there is overlap in naming conventions (but not necessarily in function) for these concepts in Power BI. Power BI’s structure is similar to Tableau’s in many ways, with data elements that can be either categorical or quantitative. For any calculations that you want to perform on either of these, you’ll apply DAX formulas just like you would write calculated fields in Tableau.
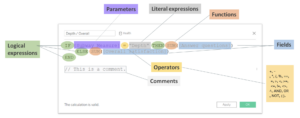
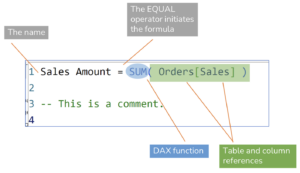
Data Analysis Expressions (DAX) is a multifunctional query language that can be used to obtain specific results or create calculated tables or columns in Power BI. Anytime you create a visual in Power BI, a snippet of DAX is generated behind the scenes. Below, we’ve identified the core components of DAX:
There are three scenarios where you’ll want to use DAX formulas: measures, calculated columns and calculated tables.
Measures in Power BI are used for dynamic and complex calculations and aggregations, such as sums and averages, based on the current context provided by filters and slicers. A measure in Power BI is just the single-value result of a DAX formula that you can add to a visualization. In this sense, they are very similar to Tableau’s native aggregate calculations. They are more efficient because they are not run every time the table is accessed, rather at query time as you interact and filter. There are two ways to create a measure, either from scratch or using the built-in Quick Measure tool.
You’ll be happy to hear that we don’t have to write out every measure. Since DAX is working behind the scenes, when you drag a column and it aggregates to a SUM() or AVERAGE(), you automatically created an implicit measure. An explicit measure, on the other hand, is the one you create with predefined functions for more complex, custom calculations.
As you may remember from Tableau, we can set specific fields as a context filter, which will subset a smaller table on which to perform the rest of the analysis in the view. In Power BI, evaluation context is one of the most important lessons you’ll have to master: row context and filter context. Row context happens any time a table is iterated on, which is whenever a formula evaluates record by record (by default for calculated columns, for measures when using iterator functions). Filter context (only for measures) happens first and is applied to data before any other DAX is calculated. The added benefit is that we’re doing a calculation against a smaller number of rows. Filter context can be applied as:
- Attributes in rows or columns
- Via a slicer
- In the filter pane
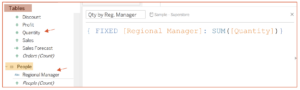
- In a calculated measure (example: CALCULATE(SUM(Sales), Sales[City] = “Berlin”)
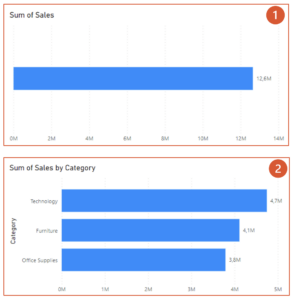
And what I mean when I say that measures are contextual is shown below. The measure Sum of Sales, as it stands on its own, returns the total amount of sales. When I add Category to the y-axis, we then get the sum of sales grouped by category. Or, if I added Category to the Filters pane, the total sales would be adjusted by the filtered categories. You will remember a similar behaviour in Tableau where measures are grouped by dimensions that we bring into the view:
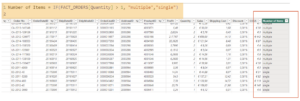
Calculated columns in Power BI are useful for static calculations and are created within tables and are computed row by row. A simple example is to concatenate the first and last name which returns a new value for each record, or in the screenshot below where we categorized orders by number of items. More specifically, calculated columns most closely resemble row-level calculations in Tableau. They are calculated at data load and every time the data is refreshed. See an example of a conditional column below, the syntax is like the IFF function in Tableau:
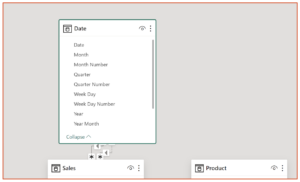
 Calculated tables are a result of a DAX statement that references other tables in the same data model. You can think of it as a SQL query result, where you get a table based on which columns you selected. The only difference here is that this table exists as its own object and can be referenced in the data model. The most common use is a date table where we can create custom set of dates to use in our analysis. There is really no equivalent to this functionality in Tableau:
When to Use a Column vs. a Measure: Use calculated columns when you need to evaluate each row — for example, categorize or subset data based on the calculated result. Use measures for calculations that aggregate multiple rows, like sums or averages, which are dynamically recalculated based on the report’s current context.
Calculated Column
- To evaluate each row
- Adds a new column to the table
- Calculated when data is loaded and when data is refreshed
Measure
- To aggregate multiple rows
- Adds a new field that you can add to a visualization
- Calculated at query time as you interact and filter
Where to Write Them:
Calculations can be created in the Power Query Editor for pre-loading transformations, in the Data Model for calculated columns and measures that are part of the data model itself, and directly in report views for measures used in visualizations.
Watch out for an unfortunate quirk with the New Measure button: If you don’t have a table highlighted in the Fields pane before you select this button, Power BI assumes that the measure will go into the first table it sees in that pane. You can move them to a different table by dragging and dropping them on the new table name in the Model view.
Creating Calculations Dependent on Multiple Tables
Creating calculated fields that depend on multiple tables in Tableau can be as straightforward as dragging and dropping those fields from the data pane into the calculation editor, of course depending on your data model:
In Power BI, we are also leveraging relationships between these tables, but the process is a bit more complex than working with a single table. It requires a clear understanding of how tables are related and how to correctly reference them in DAX formulas.
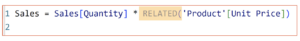
For example, we have a Sales table and a Products table related by a Product ID, and we want to create a calculation that takes Quantity from one table and Unit Price from the second one. We will need to use DAX functions that navigate relationships, such as RELATED(). The RELATED() function is used to fetch a related value from another table that has a direct relationship with the current table. In our example, we want to calculate Sales based on quantity sold and unit price, so we might use a formula like below:
Best Practices and Performance Implications
Optimizing calculations in Power BI and Tableau is crucial for improving performance and efficiency in our reports. Here’s a summary of best practices.
For optimal performance in Tableau:
- Optimize calculations: When creating calculations, aim for efficiency. We want to reduce the number of times a calculation is performed for each record.
- Use aggregation: As we mentioned, Tableau is an aggregator. Aggregating data will significantly improve dashboard performance by reducing the number of rows processed. Basic aggregation functions are usually efficient, except for distinct count (COUNTD), which should be used sparingly due to its high processing load.
- Use Boolean and Integer Data Types: Booleans and integers are processed faster than strings.
- Minimize nested calculations: Reduce the complexity of calculations by avoiding excessive nesting. Using CASE or ELSEIF statements can be more performance-efficient than complex nested IF
- Extracts instead of live connections: Use data extracts to improve dashboard load times, especially with large datasets. Data extracts materialize calculations, enhancing performance. In addition, use data source filters and hide unused fields.
For optimal performance in Power BI:
- Calculated Columns: Best used for row-level calculations that don’t change with report interaction. They increase the model size but are calculated once upon data refresh. Calculated columns can be computation heavy since they use both disk and RAM space, unlike measures that rely on CPU only.
- Measures: While calculated columns can be useful for certain scenarios, measures are generally preferred for their dynamic calculation capabilities and minimal impact on model size. They require computational resources only when the report is interacted with.
- Optimize with variables: Variables can greatly improve the readability and performance of your DAX code by storing the value of an expression that is used multiple times in a calculation.
- Minimize the use of FILTER function: The FILTER function can be resource intensive since it iterates row per row. You can use direct Boolean conditions within the CALCULATE function to achieve similar filtering.
- Be extra mindful of the evaluation context: A deep understanding of row context and filter context is crucial, as confusion between these can lead to inefficient DAX and incorrect results.
A true comparison between two powerful platforms like Tableau and Power BI would be a textbook topic in itself, but hopefully a few examples have helped you understand some of the key differences and near overlaps.
Tableau’s use of dimensions and measures allows for granular data organization and manipulation. The ability to convert between dimensions and measures, along with the use of calculated fields, provides a dynamic environment for data exploration.
Power BI, on the other hand, emphasizes the use of DAX to create robust data models and calculations. The distinction between calculated columns and measures in Power BI highlights the importance of understanding the context and performance implications of each.
If you’re interested in learning more about these two powerful platforms, stay on the lookout for more on our blog.