
A video version of this post is available toward the bottom of the page.
Ready or not, A.I is coming. It’s the latest buzzword that we’re all hearing everywhere! The problem is very few of us understand what it is and the impact it will have on our daily life and work. For me, the very best technologies impact our lives positively and become somewhat natural and invisible in use. The smartphone is an example, as all of us now use mobile phones as part of our lives. It was Steve Jobs that said, “Computers are like bicycles for the mind.” By using a bicycle, humans become the most energy efficient creature per kilometre above any animals. I see A.I. as taking the bicycle and making it an e-bike at this point! Someday it will become the electric or hydrogen car with heated seats and air conditioning.
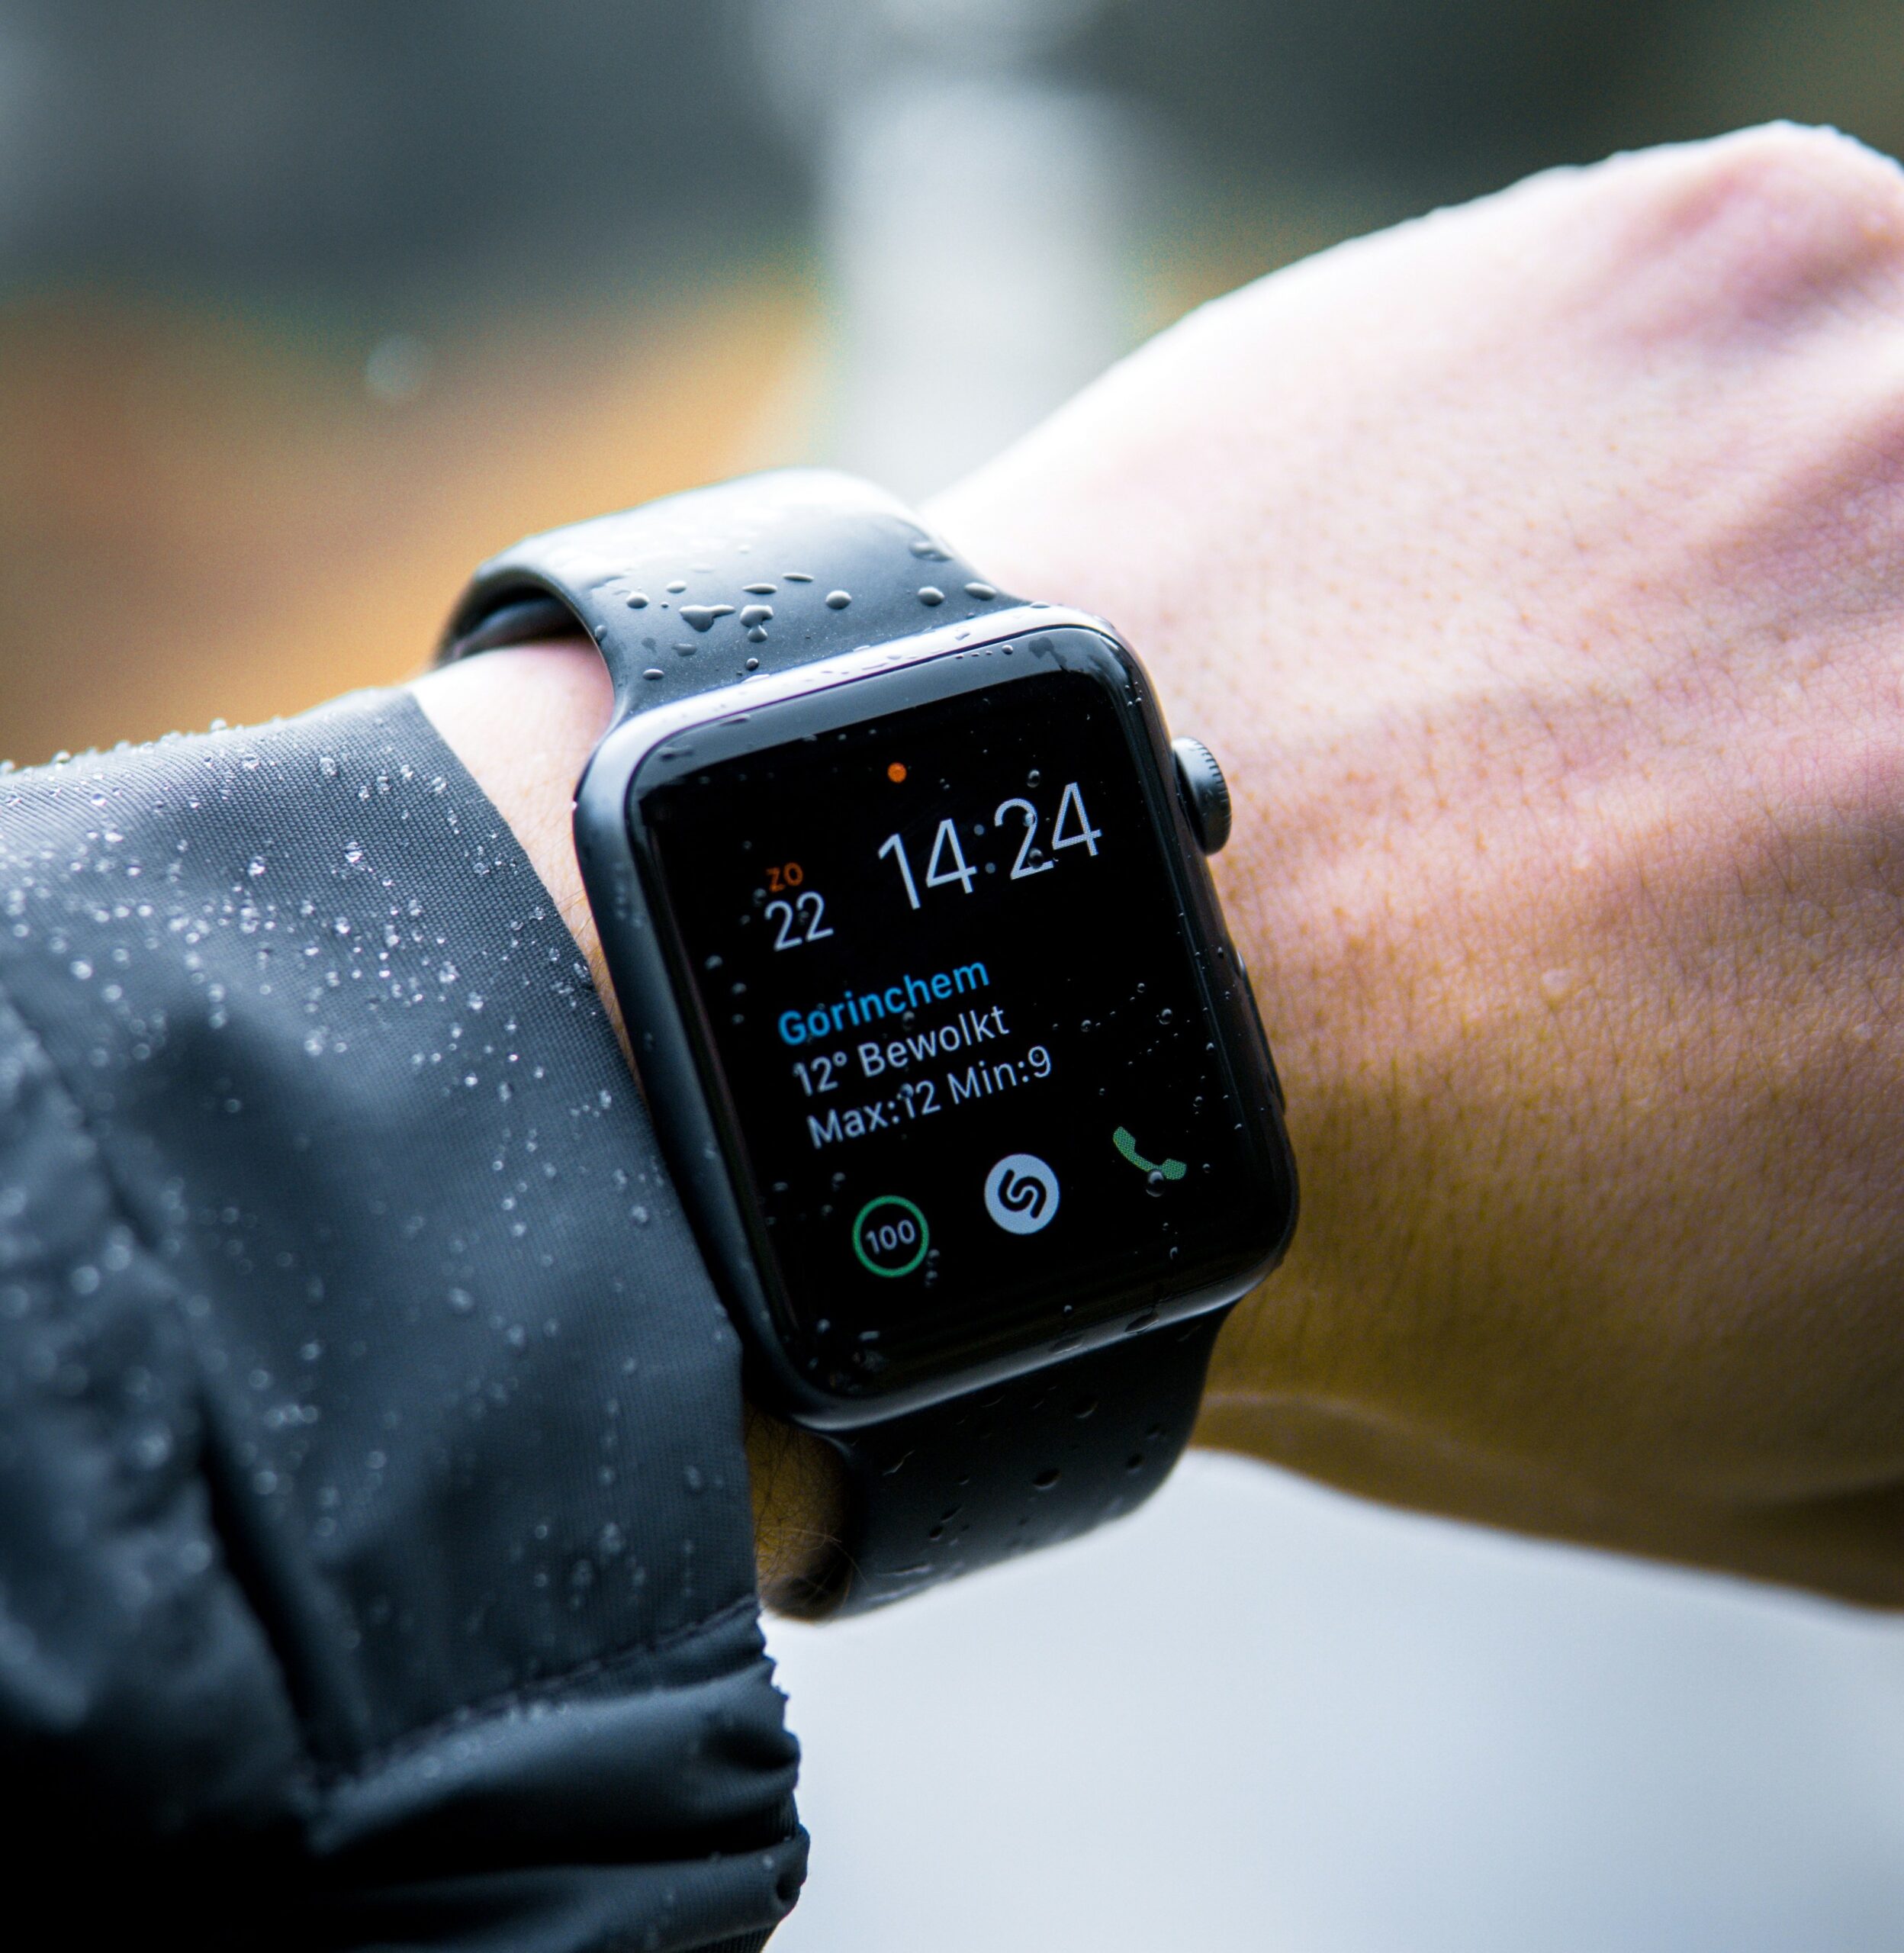
Above: Another seamless innovation is the smart watch, which I’ll touch on more below.
We now have vast datasets and limited time to process them. Even using BI tools requires effort to understand what is happening in the system we are studying. A.I. is adding an extra brain that has rules, can infer meaning, see context, and create meaning and understanding through the relationships in the data.
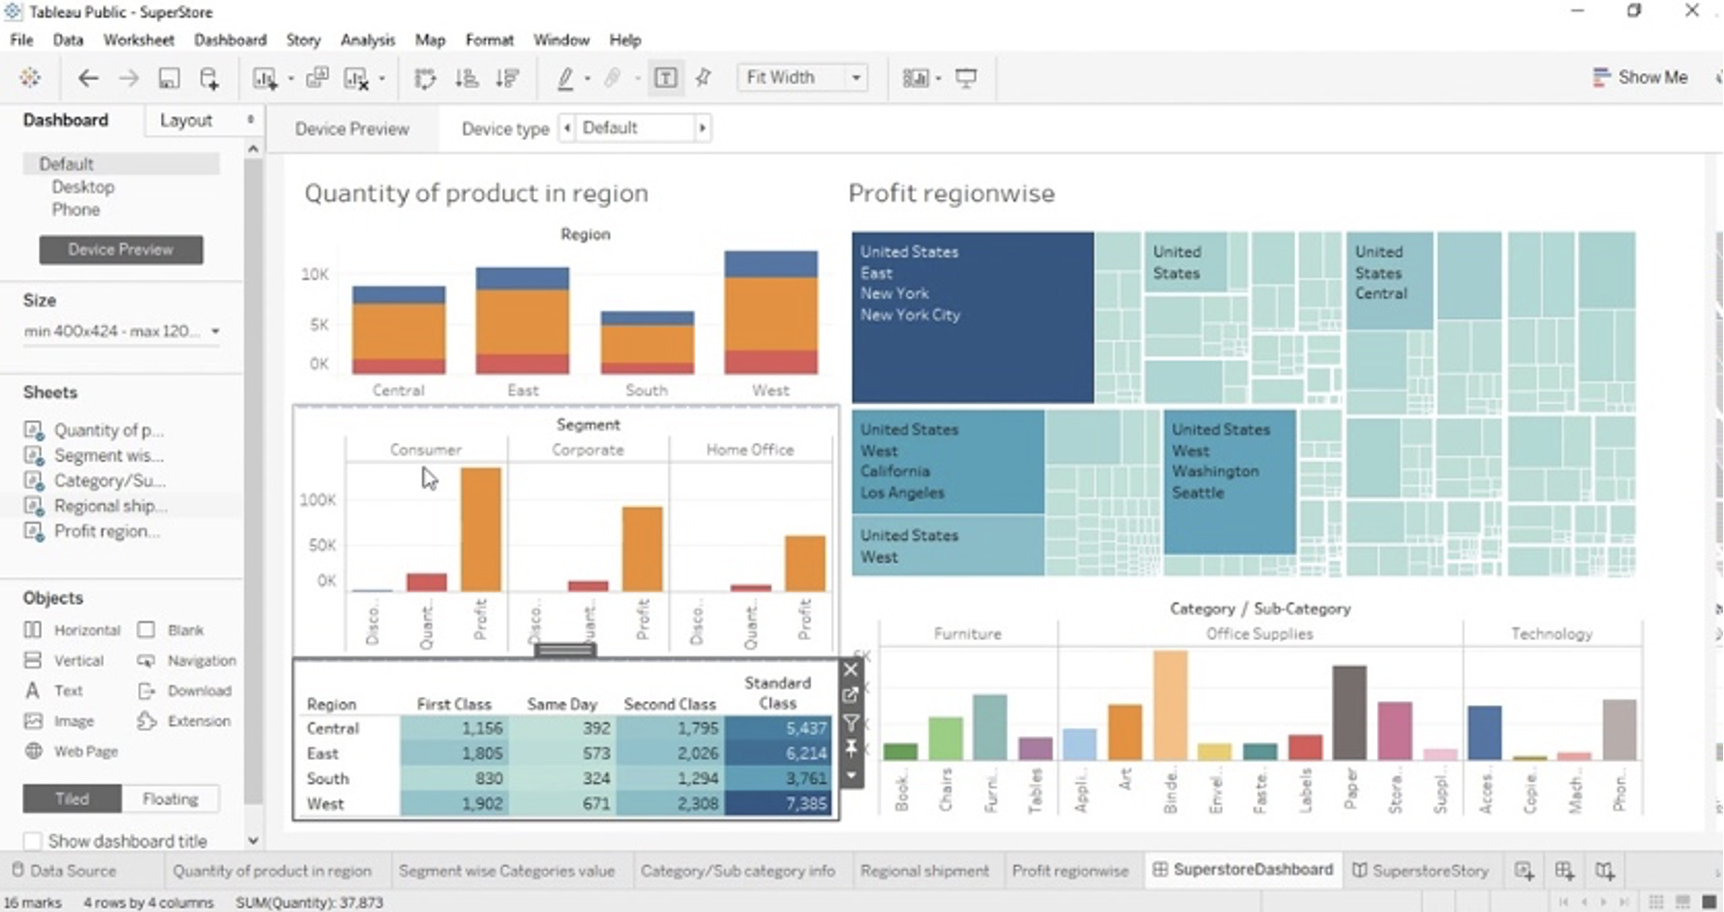
Above: Look at all those boxes in the tree map. What is it telling me and what should I do about it?
Only 25-35% of people in business are getting value from data today, partly due to the learning curve of data, databases and current generation BI tools.
Very few people have the time or interest to learn a new tool, but everyone has questions that need answering to do their job. This creates a natural, and potentially huge, backlog of questions that could be solved with data. The biggest problem many of us have is not enough people with the required skills to answer them.
I suspect, from experience, that nearly everyone has two or three metrics or questions that direct how they do their job and what good looks like. Every organisation, every department, every team, has a core defining goal that is critical to their success. And that goal should be visible to all and owned by the group both in delivering the execution and it’s measurement.
A.I. then can add another layer to metric analysis by looking deeper into possible causes for the current measurement, it can also generate context and inferences to explain that data. This then can direct our response and behaviour to deliver the goal more effectively.
AI In Day-to-Day Life
So, what could this look like? Let’s think of a few simple everyday examples: Activity and step counters. I have an Apple Watch and I follow the rings and steps. That drives immediate changes to my day as I may get up and go for a walk or hop on the bike. The weekly digest I then receive gives me broader context of my activity so that I may change longer-term habits to hit my goals. It reminds me what good looks like. The Apple Watch also uses AI to track things like sleep quality and heart health, which effects my health activities. This is an example of AI that is part of our daily life.
Many are not yet there in business, however. Think about the metrics important in your business. For a CEO, it might be tracking net profit. For a sales team, it could be lead pipeline which directly affects sales opportunities. For a maintenance department, it may be incoming tickets or repair times. I’ve found Tableau Pulse to be very helpful in creating, tracking and improving my work here at InterWorks.
These are important metrics, and they depend on many inputs that A.I. can track and relate to generate deeper insight.
I’m hoping thinking this way about our business activity is interesting to you, so the next question is, “Where do I start?”
Start Here
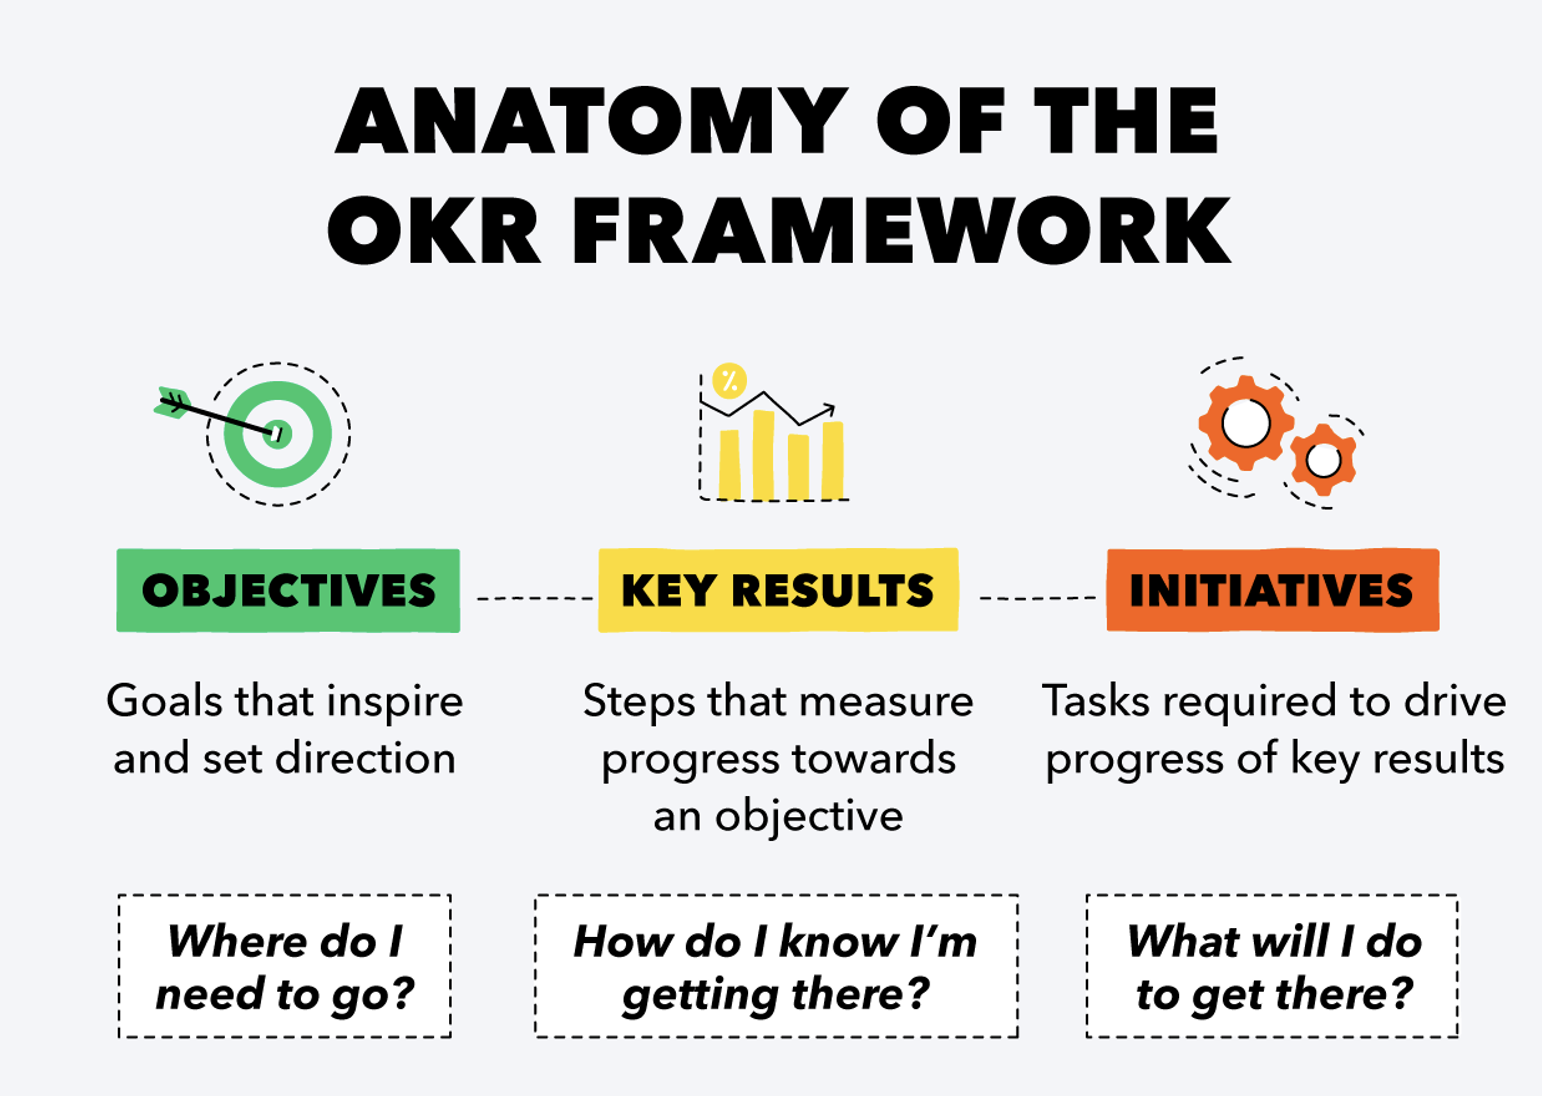
- Identify the metrics that are important to you and drive positive behaviour and outcome in your organisation. Keep it simple, but impactful. Try to choose two or three of these to start with. I like to think of these like OKRs. What is the objective of this metric? It could be, “Increase the number of opportunities in our sales pipeline.” If so, then what are the related key results? These then become your metrics that you track. In the example above, the metric could be “lead inflow per day” or “sales outreach activity per day.”
- You now need the data. Remember — with Tableau Pulse, we need published data sources. These may already be on your Tableau Server, or you may need to publish your own or reach out to your analytics team to create it for you. Again, it keep it simple for now. For instance: “Count of leads” plus a time dimension like “lead creation date.” The best data for metrics such as these is updated frequently. I’ve got a request for the analytics experts in your business: Please deliver data sources that are governed, trusted, correct and timely so that your business users can self-serve the metrics they need.
Wrapping Up
I’m excited about what Tableau Pulse and AI are delivering with regards to value in our businesses and day-to-day activity. It’s one of the very first real, potentially ubiquitous, applications of AI. Now, the future looks amazing and Tableau Pulse is leading the charge.
Feel free to reach out to me or InterWorks with your thoughts and questions around finding your path to AI.