
There has been a broad trend toward self-service that has applied across industries, across geographic boundaries and long time periods.
We once expected to be served individually by butchers or bakers, but now help ourselves from a supermarket shelf. In industry, corporations once employed armies of typists and secretaries, but now most of us manage our own typing and administration. Petrol stations once employed forecourt attendants to operate the pumps, and lifts required operators to open and close the doors and call out the floor. This all added to staff costs, of course, and in many cases created bottlenecks. A shopkeeper behind a counter can only serve one customer at once, so queues build up.
One reason we once needed lift operators and petrol pump attendants was that the machinery was difficult and potentially dangerous to operate. Petrol pumps did not have the automatic cut-offs they have today, so an untrained person could easily spill fuel all over the forecourt. Lifts did not have self-closing safety doors, so they needed an operator.
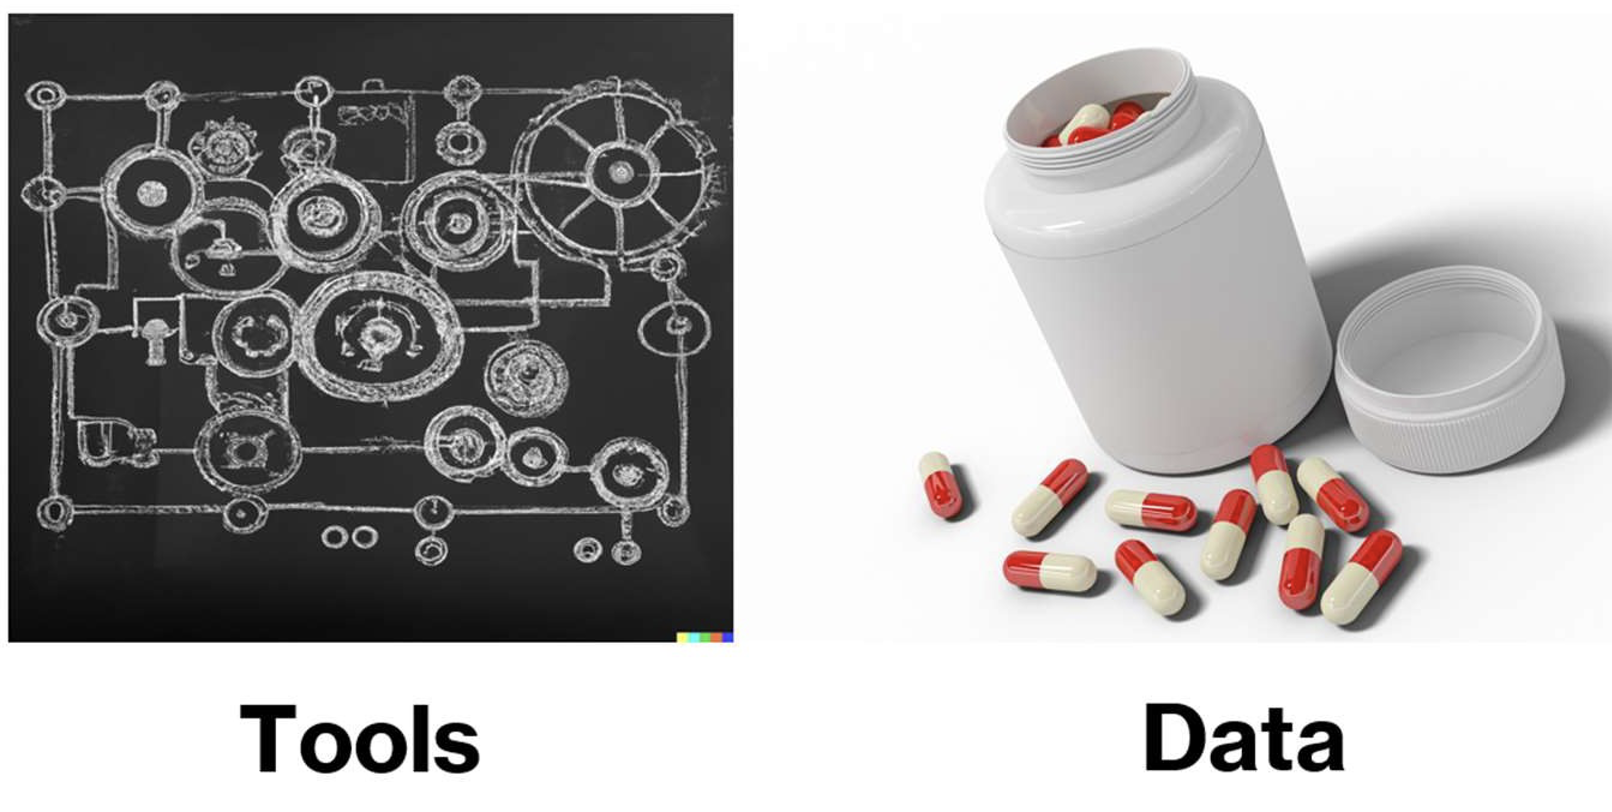
In data analytics, there are two separate challenges. The tools used to process and display data can be complicated. The data comes in a wide variety of technical formats and is often poorly documented. While these challenges remain, self-service isn’t going to work, and we’ll remain reliant on an army of data specialists acting as intermediaries between the technology and those whose job it is to use data to make decisions.
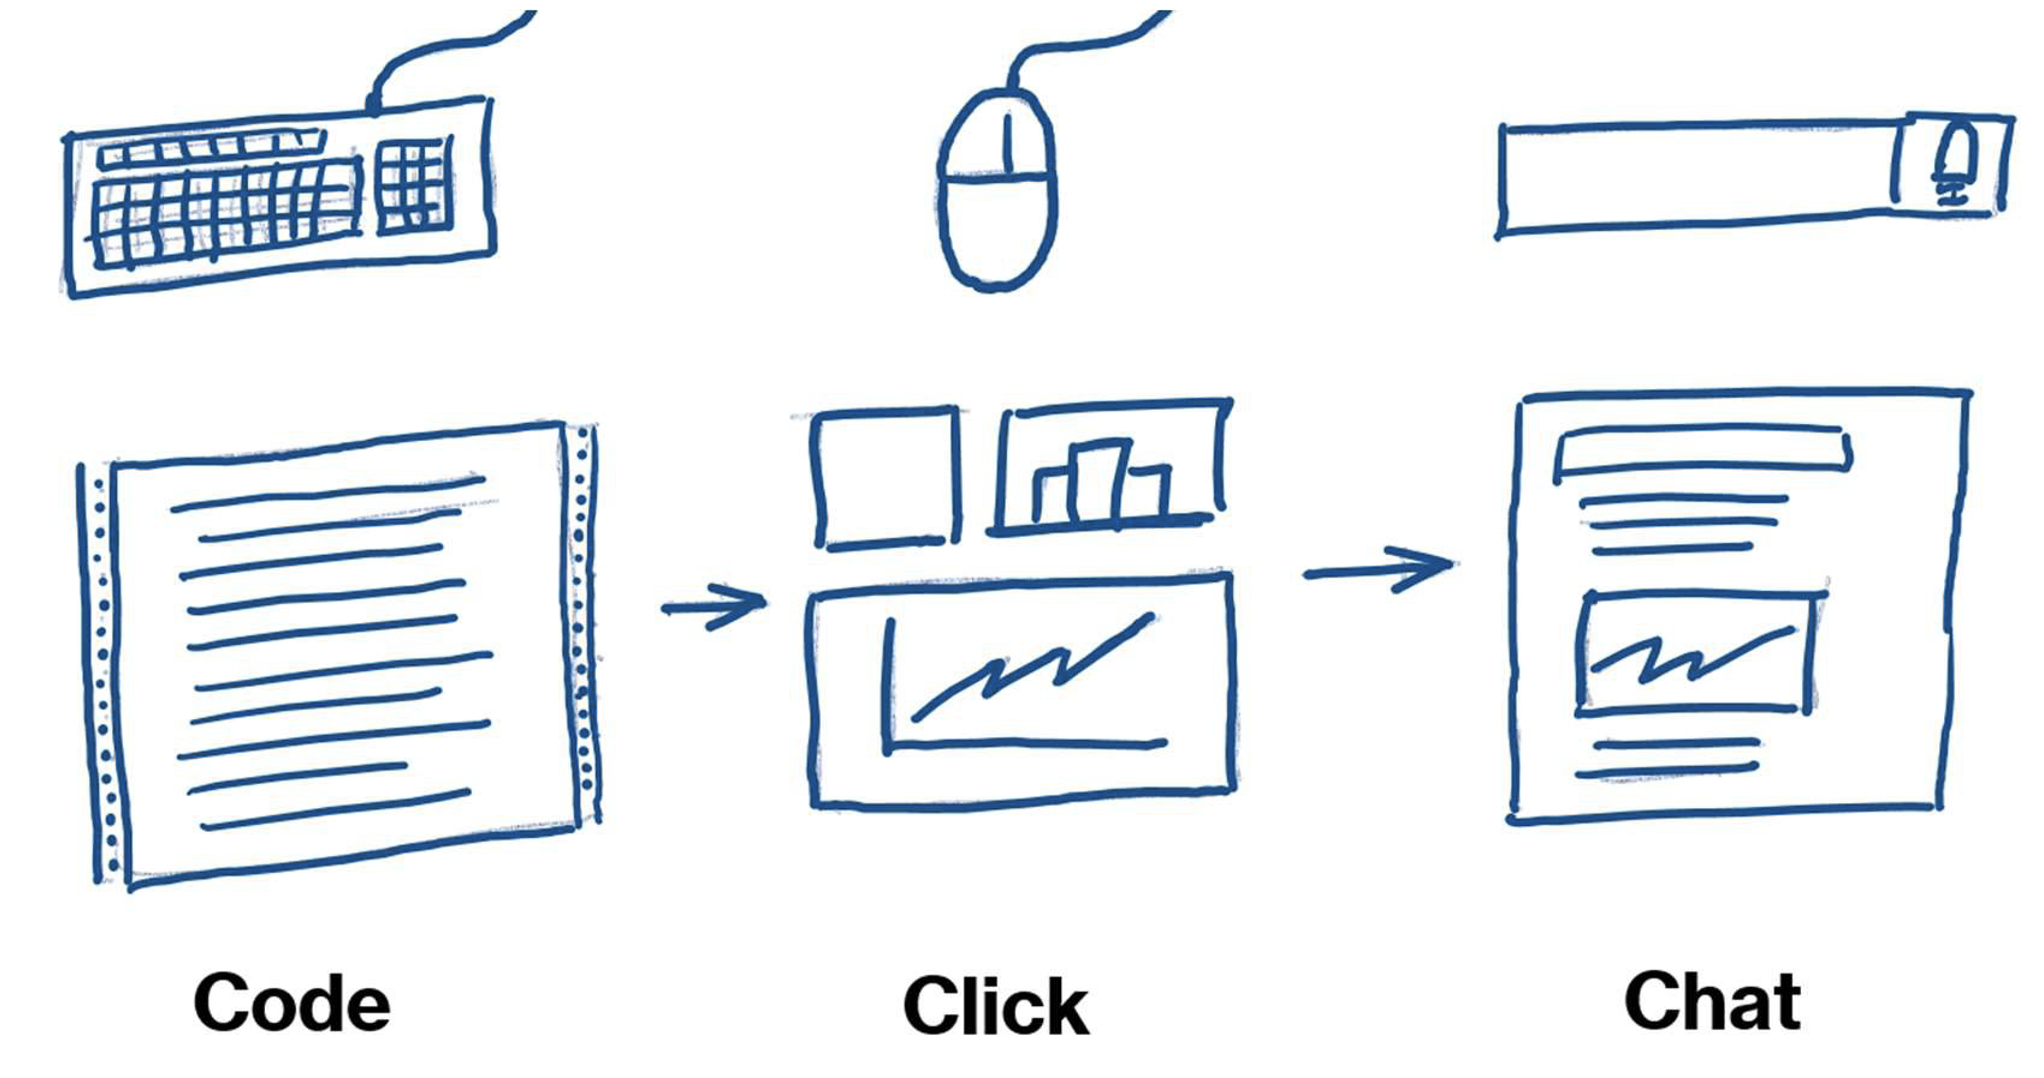
Analytics tools have evolved over the years, from reports coded using traditional programming languages like RPG or COBOL to dashboards put together with the click of a mouse.
Code
For programmed reports, any change to formatting or calculations would require new code. Creating and maintaining reports like this was expensive, so many organisations would make do with the bare minimum.
Click
Later, a new generation of graphical interfaces meant that the obscure commands used by programmers were replaced with menus, buttons and drag-and-drop actions. A new generation of user-friendly analytics tools appeared.
The earliest tools in this space, such as Crystal Reports and Cognos, were still aimed at developers, but soon tools like Tableau (“Analytics for Everyone”) and PowerBI (“Empower everyone to make data-driven decisions”) emerged that pitched themselves squarely as self-service products.
Business users and decision makers could analyse their own data without outside help. Many organisations benefitted from having analytics capabilities applied closer to the point of need and to a much wider variety of use cases.
Over time, the new graphical tools became more advanced. New features were added, which then meant new menu items, new terminology and new configuration options, complicating the user interface. A tipping point occurs when what had once been an easy-to-use tool needs a training course before someone can use it.
Chat
We first started to see widespread natural language interfaces a little over a decade ago. Apple’s Siri was introduced in 2011 followed by Amazon Alexa and Microsoft’s Cortana in 2014. Asking Siri to send a text message or set a reminder can be quicker than thumbing through your phone to find the right app, and press the right buttons, but as of today (Sep 2023), Siri is not capable of responding to more advanced requests.
In late 2022, after the launch of ChatGPT, it became clear to everyone that it was possible to interact with computers in a much more sophisticated way using natural language. Since then, analytics vendors have been scrambling to incorporate a chatbot-style interface into their products.
One of the first companies to do this successfully was ThoughtSpot, announcing ThoughtSpot Sage in March 2023. They are particularly well positioned as they had long been aiming at the self-service market and their interface was already based around using text queries to interrogate data. LLMs now allow those queries to be in a true natural language rather than a quasi-natural tokenised form.
Since then, we’ve seen the integration of PowerBI with Microsoft’s Copilot in May 2023. Tableau also announced a natural language interface, “Tableau GPT,” in April 2023. It is expected to be available in early 2024. If these natural language interfaces become ubiquitous, we will have gone a long way toward overcoming the obstacle where consumers of data are not able to serve themselves, because the tools are too difficult to use.
Analytics tools based around large language models may have their own problems though.

There is a tendency for large language models (LLMs) to confidently lie to you. This may be fine if you’re asking a chatbot to generate a humorous poem, but it’s not okay if you’re asking your analytics platform about sales forecasts or how your cashflow is doing. There is now some solid research into the causes of hallucinations in LLMs. The research says that some (not all) hallucinations can result from noisy or poorly labelled training data. Garbage in, garbage out. If your large language model is trained on dirty or ambiguous data, you’re not giving it a chance.

Professional data analysts may have the expertise to spot and work around missing or dirty data. Where data is made available to for self-service, that same level of expertise may not exist.
Where Are We Now?
The benefits of self-service analytics are wide ranging and proven. The obstacles to self-service in the past have been the complexity of analytical tools and a paucity of well catalogued, high-quality data. Large language models are making a new generation of analytical tools much easier to use, but the problem of patchy and poorly labelled data remains. It’s now more important than ever to make the data as clean and well described as possible.
In my next blog, I will look at some of the problems organisations encounter with the centralised “single source of truth” approach to data architecture, and look at the data mesh architecture, a distributed approach that provides better scalability, particularly for large or complex organisations that have outgrown the enterprise data warehouse.