
On a recent client project, my colleague Emily Miley and I found a practical use case for dynamic zones that I’ll be using often. If you’re unfamiliar with the dynamic zones feature, we’ve got you covered! Check out this blog post first and then come right back.
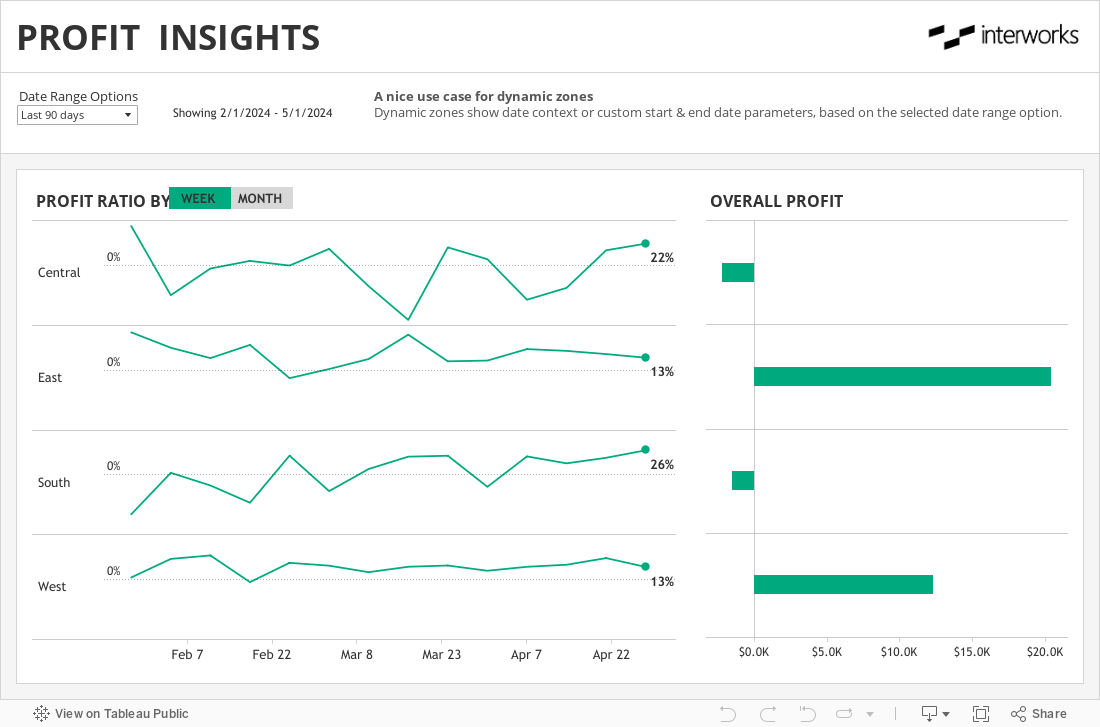
During the course of the project, the client asked us to build in some common date range options for users (options like this week, this month, this quarter, etc.). We always like to add a custom option that allows users to specify their own start and end dates in case none of the preset options work for them. In the end, we built something similar to this, and I’ll walk you through the steps below next:
Life Was So Hard Before
Before dynamic zones, you needed some pretty hacky methods to get those custom start and end date options to display only when users needed them. We won’t go into details, but one method involved floating objects that moved on and off the screen. Like I said… Hacky.
We generally try to avoid hacky methods that are hard for other developers to understand, so we’d often resort to static displays like you see below, with a note that users needed to select Custom Range from the first drop-down to use the Start and End Date options. It wasn’t great, because it had the potential to confuse users, but it wasn’t always worth building a complicated work-around to fix it:
Life is So much Easier Now
But with dynamic zones, we now have a simple way to toggle on and off those custom date options. All you need is a Boolean field. Here’s how we did it.
For our date range options, we have three options in this workbook (we had several more in the client workbook, but we’ve simplified things here):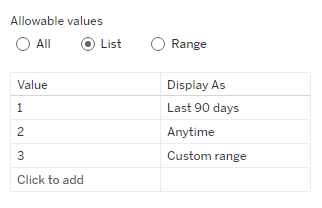
When users select options 1 or 2 (“Last 90 days” or “Anytime”), a calculated field determines which dates to include automatically. (Feel free to check out our calculation later if you’d like. The workbook is available for download at the end of this post.) But when the user selects option 3 (“Custom range”), we want to display start and end date parameters so they can specify their exact range.
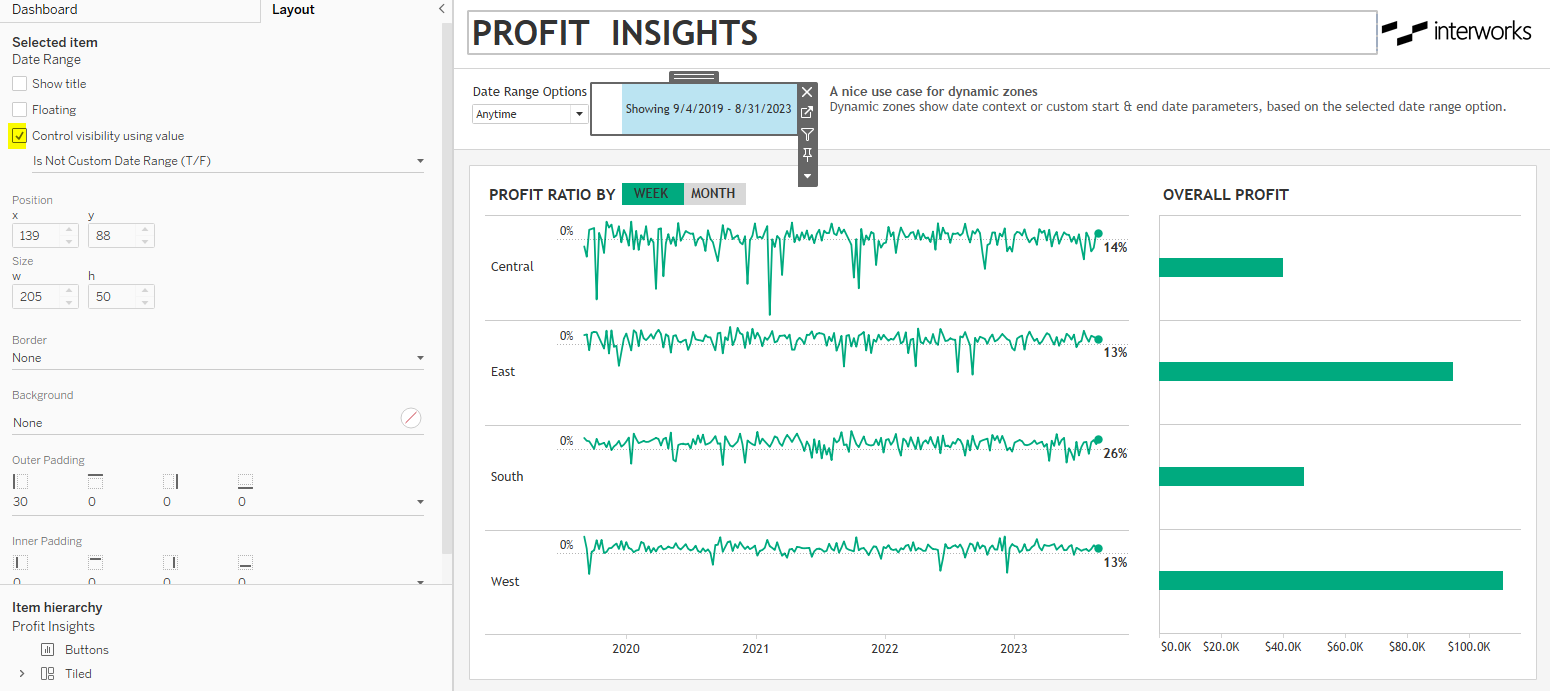
When we display those parameters on our dashboard, we just need to put them in their own layout container and check the box that allows us to control their visibility using a calculation: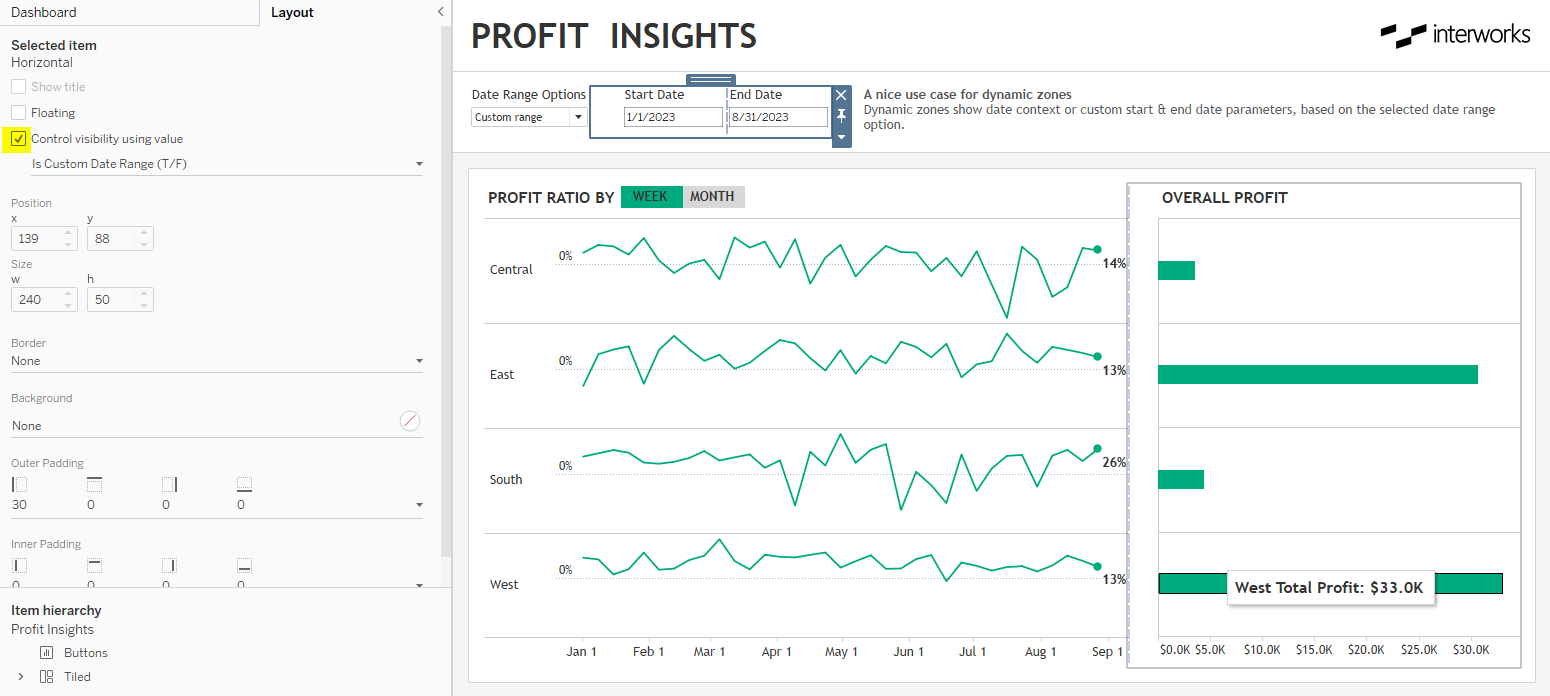
The calculation we used here is a simple Boolean formula that evaluates if the Date Range parameter (the first drop down menu) is equal to 3 (Custom Range). If yes, the formula returns TRUE and displays the container. If no, the formula returns FALSE and hides the container: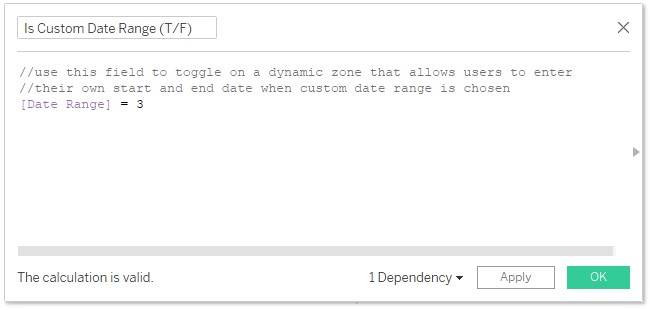
That’s all you need, but we added another sheet with date range context to help users understand the exact range they were viewing when they selected other options:
This sheet was controlled by a separate calculation that evaluates if the Date Range parameter is NOT equal to 3:
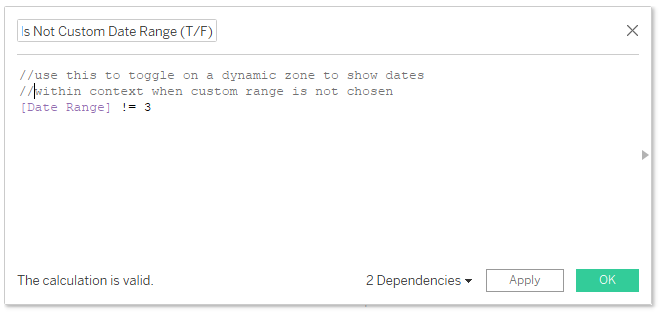
So this sheet displays for all other date range options (Last 90 days and Anytime) to specify the exact start and end date of those predefined options.
This small addition helped us produce a dashboard that was intuitive, flexible and clear. Feel free to download the workbook if you’d like to take a closer look:
If You Want to Grow Your Skills
Want more tips on making intuitive, flexible and clear dashboards? Sign up for our UCDD course and we’ll teach you many of the things we’ve learned over the past decade of making user-centered dashboards.