
Throughout Women’s History Month, we asked a few of the women here at InterWorks to share some of their stories of womanhood and how they came to work in the tech industry. This series was curated by Sara Pineda, InterWorks’ Employee Experience Intern, and will be shared over the next few weeks.
How I Found My Way to Data
There I was, in orientation for my new position with a corporate software company. In the auditorium shined three huge projection screens with brightly colored slides welcoming us to the data community. I hadn’t felt this spark of excitement in years. The first presenter was speaking on the history of data visualization. He shared a hand drawn map created by Charles Joseph Mindard, a French engineer who used a combination data map and time series line chart to portray Napoleon’s Russian campaign of 1812. Intriguingly complex, yet simple in design, the presenter broke down for the audience of data engineers, analysts and technical experts what I, as an artist, could see immediately — how Minard used color, line thickness and space to powerfully illustrate the effect the long winter journey had on the survival of Napoleon’s army. The map was called Tableau Graphique and is considered one of the best statistical graphs ever drawn (Tufte, 2001). I knew I had made the right choice to join the data world.
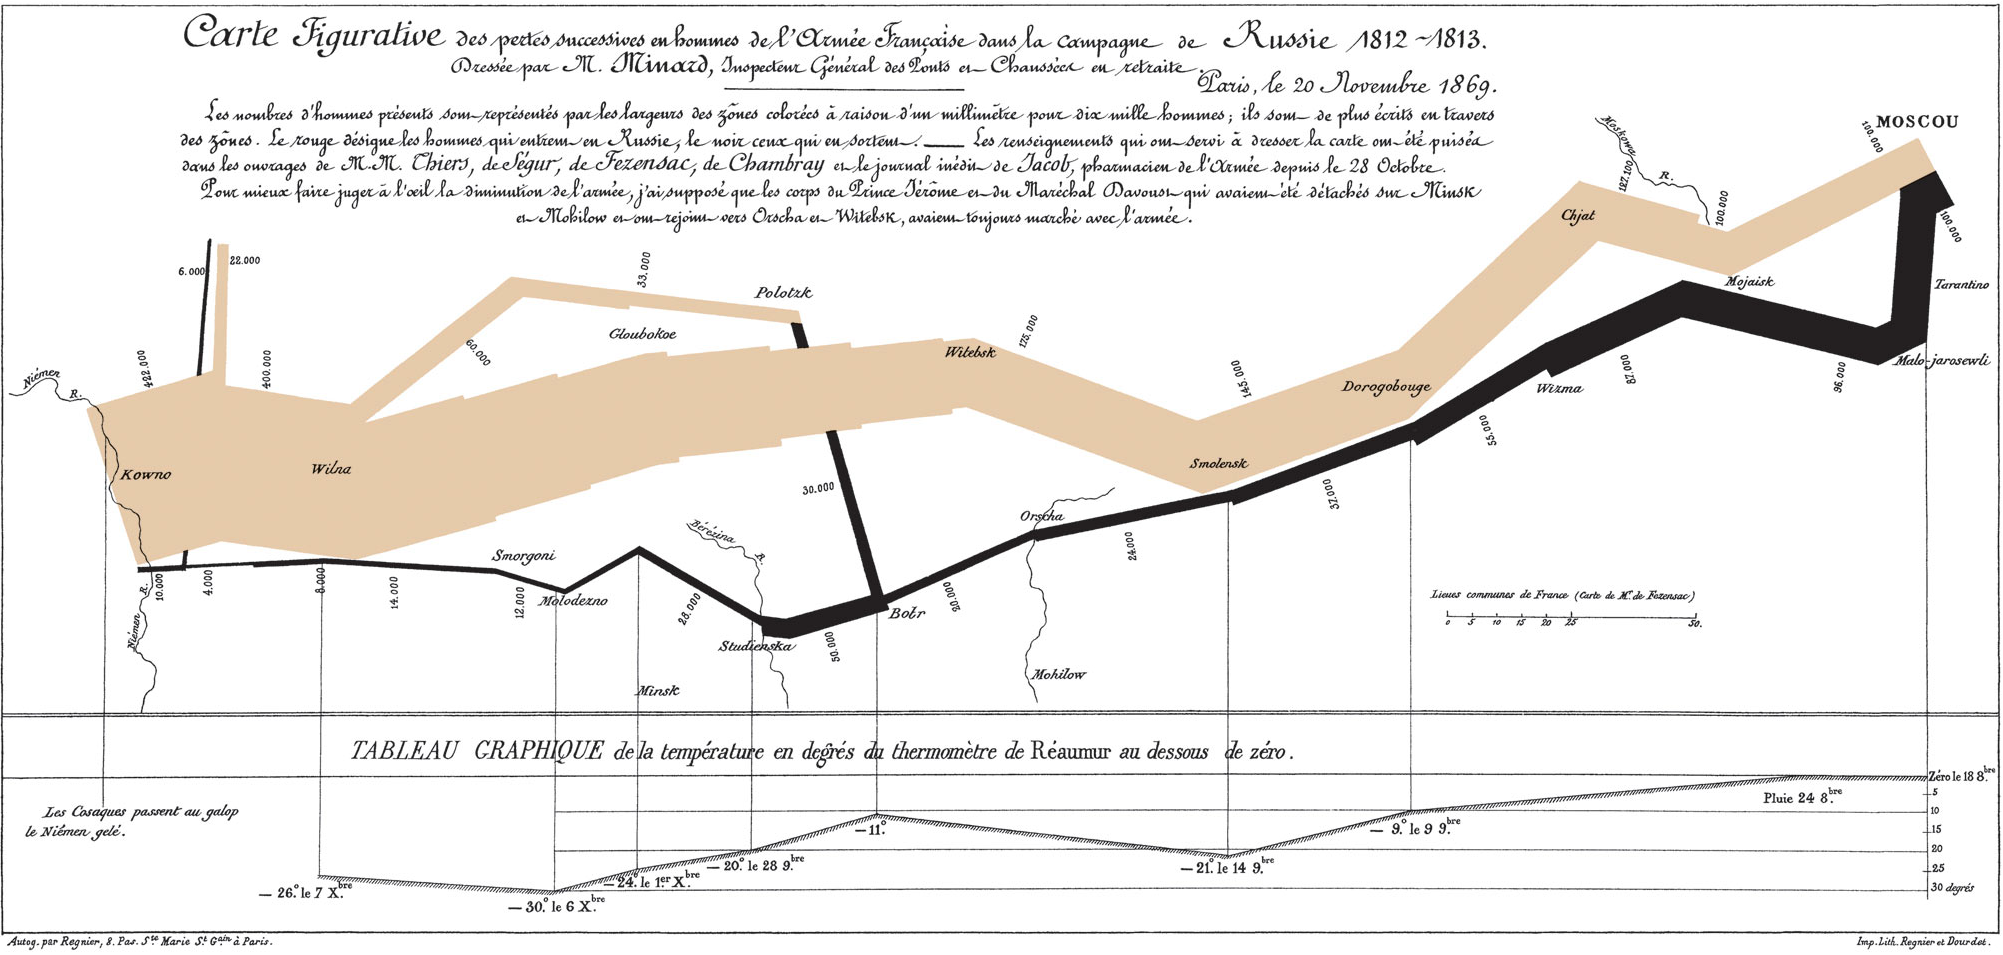
Above: Tableau Graphique by Charles Joseph Minard
Entering the field of data was an exciting, but also terrifying, career shift. In some ways, it made sense all along. I excelled at problem solving, was always a star student in math and science, yet I also had an undying passion for the arts and teaching. I decided to get my undergraduate degree in studio art and education and became a visual arts teacher. I think if I had known about data visualization in high school, I would have hit the ground running on an analytics degree.
However, I really enjoyed the energy and passion that seems to emanate from working with artists. Art taps into the foundations of humanity, exploring topics that unite cultures. Art reflects our history, our desires, our questions, our seemingly disconnected lines of thinking. Art inspires curiosity and teaches us that problems can have more than one solution. The arts celebrate that there are many ways to see and interpret the world. Now that I am a data visualization designer and analyst, I can see how all of these things are also at the heart of why we capture and explore data.
Data records our history and helps illuminate areas we can grow. Data allows us to explore multiple solutions to a problem, even test their viability before we act on that solution. Data, when visualized, can also have the power to persuade, to influence social change. Data can help us see and interpret the world. I also found that members of the data community were just as passionate, quirky and creative as artists. Both art and data held and ignited my passions.
From Teaching to Data
So how did I make the leap from a K-12 art teacher to an analytics consultant? I’ve always been a life-long learner. So naturally, I went on to get a master’s degree and a Ph.D. in Art Education. During my dissertation writing, I became frustrated with the limited ways in which data was being recorded and presented in education. I hated taking the rich qualitative and quantitative data I had been collecting and presenting it as tables. I wanted to tell the story of my research artistically. After all, I had been exploring what it means to teach empathy through the arts. The story had depth, color, grit. It was more than the data I had collected. I started looking into what data visualization was all about. Around the same time I was wrapping up my degree, I went through a painful separation that ultimately ended in divorce. I found myself a single mom of two young boys with only my teacher’s salary to get me by. It wasn’t cutting it. I started considering other jobs outside the field of education.
My brother was working in BI at the time and introduced me to this data visualization tool called Tableau. I was stunned! This was his data? I could interact with it, explore with a click, and it was colorful and appealing. I was instantly curious and started attending the Atlanta Tableau User Group. The user group always takes time during the meetings for people to network and I was introduced to a Tableau recruiter. After sharing that I was an educator with experience in higher education, she asked if I had any interest in corporate training. I immediately said, “Yes, of course!” The next two weeks were a whirlwind of excitement and dread. Along with preliminary interviews, I had to do a teaching demo. I had three days to download a trial of Tableau, learn the tool and prepare to teach a segment from their advanced training course to a panel of internal experts. I went through all the insecurities as anyone might who’s shifting careers: From “Am I smart enough?” to “Can I actually do this?” and “But I don’t know anything about business!” and “What about travel?” This is WAY out of my comfort zone.
Right before the teaching interview, I sat in the waiting room and gave myself a little pep talk. I listed all the hard things I had accomplished over the past couple years: finished my Ph.D., published book chapters, presented curriculum research in Germany, got out of an unhealthy marriage, bought a house, moved my boys, set healthy boundaries, paid off my car, started a new relationship. I could teach a 15 minute demo on box and whisker plots!
In the end, I nailed the interview. They offered me a position the very next day. I was in the car headed to pick up my sons from school when I got the call. I had to pull over and cry. Cry, because I was overwhelmed with gratitude for the opportunity to do something new. Cry, because it meant being able to plan for my sons’ financial futures. Cry, because it was a fresh start in something I was passionate about. Cry, because someone else saw the potential I could bring to their organization. They liked me for my diverse and unique gifts. They didn’t see me as, “just an art teacher.” I would, from this day forward, be a woman in data.
Now, to Consulting
I continued in the field of data with a few different roles until I realized a truly loved the dynamic nature of consulting. It is teaching and problem solving rolled into one. It is building solutions that organizations use to make decisions or improve the lives of others. As an analytics consultant at Interworks, I get to continue my passion for design and the arts by building dashboards for clients. I also get to evolve my passion for teaching through enablement offerings both within the company and outside. We are company that encourages curiosity and a self-starter attitude, and I’m thriving because of it.
Interworks also prides itself on how we interact with our communities. Being a woman who changed careers in her late thirties, I now look for ways I can influence and encourage women at any age to enter the field of data and discover their passions. I enjoy being a mentor, group speaker or just listening to others on their career journey and sharing lessons we’ve learned. Feel free to reach out and connect! Happy Women’s History Month!