In our last blog post, we talked about the 3 principles to User-Centered Dashboard Development (UCDD):
- Start with users, not with the data.
- Not just users first, but users throughout.
- Don’t build it and forget it. Build it and nurture it.
Now, we’re going to dig a bit more into how we can put those principles into action in our day to day work. The most logical place to start is at the beginning.
Step One
At InterWorks, we have defined a 7-part UCDD framework to help guide dashboard managers through developing a new dashboard. The first part is Understand.
Now your first thought here may be, “Ok, yes, I need to understand my data.” But don’t forget about our first principle: Start with the users, not with the data. Here, we’re actually talking about understanding your users:
- What are their current processes like?
- What are their biggest pain points?
- What do they like about their current reporting? What do they not like?
- What are their goals and KPIs?
- What problems are they experiencing in their workflow?
These are just a few examples of questions we may explore as we work to understand our users. It’s important to remember that users are people just like us. Just as we are trying to do our job by building amazing dashboard solutions, they have jobs that need to be done and they experience similar highs and lows in their workday. If we step back for a moment and take off our ‘developer’ hats and put on a ‘product manager’ hat, we can uncover problems the users are facing and ideate solutions to solve those problems.
Examples of Understanding
Maybe right now, our users have a sales interface that allows them to see disparate data points for a point in time. However, they’re frustrated because if they want to see their growth year over year, they have to pull multiple reports and run an ad hoc comparison analysis in Excel (Ahh!) and then take that data and put it into a chart in PowerPoint… and they’re doing this every month for their monthly report. (Yikes!)
They may not know there is an option for you to bring this data together for them in a stylized dashboard, so they didn’t think to ask. But by taking some time to talk to the users and ask about their workflows, you can spot that problem and present a solution: a beautiful dashboard with YoY comparisons and the ability to easily export into a PowerPoint each month. VOILA!

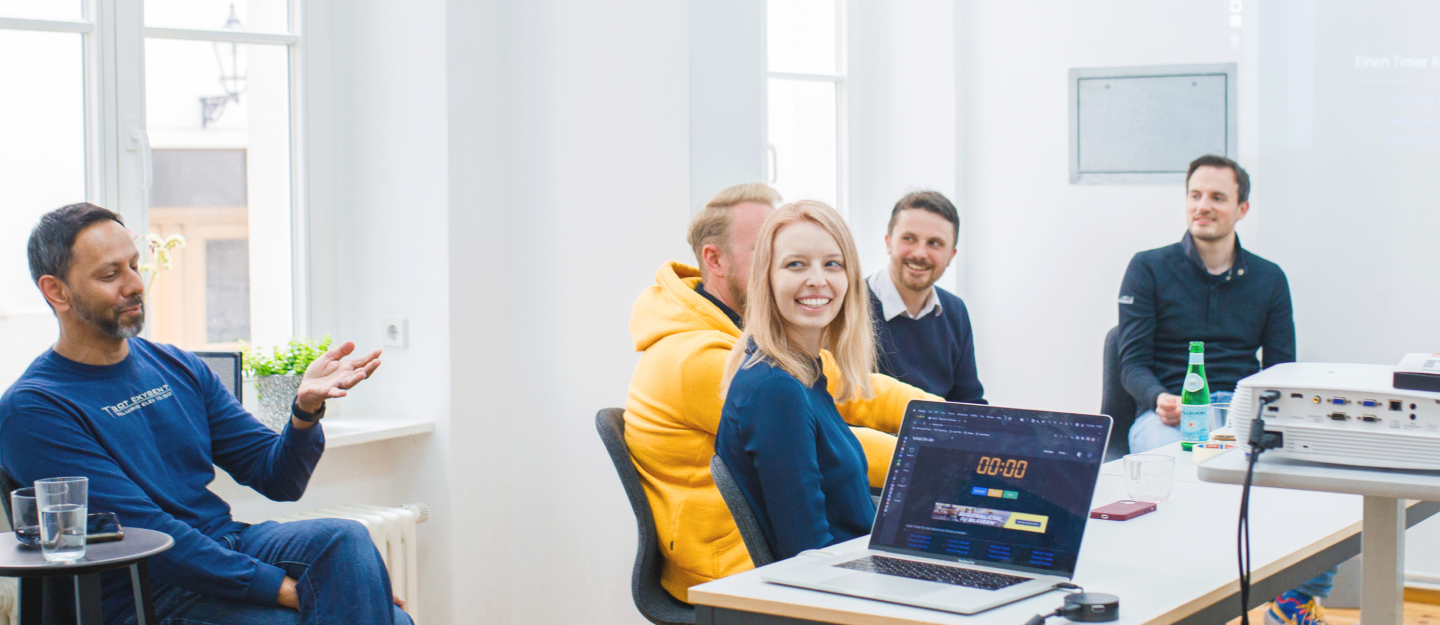
Above: The UCDD Workshop lets us help guide teams toward better UCDD practices.
Another situation that arises often here is a user comes to us with a request, but what they’re asking for isn’t actually what they need – it’s what they think they need. Here, again, we can put on our product manager hat and begin to ask questions about WHY think they need that thing.
By asking why, you’ll begin to uncover the root problem they think their requested solution will solve. Now you have more context and understanding to determine if what they’re asking for is the right solution or if another solution may work better. You’re positioning yourself as a trusted advisor in this space for them.
Users at the Center
As you talk to your users more over time, you’ll begin to connect with them and learn more about their needs and how you can help them. As you’re talking to them, you’ll begin to build a base of questions you can ask every time you begin a new dashboarding project. The answers to the questions you ask will lead you to what will become the building requirements for your dashboard.
We’ll talk more about defining those requirements in our next UCDD blog installment. In the meantime, if you’re interested in launching User-Centered Dashboard Development at your business take a look at our UCDD Workshop and consider having an experienced InterWorker guide you through all seven phases of the UCDD process.

