
Have you ever been asked to create a dashboard with some sub-standard data? Maybe you don’t have the amount of data columns you would want, or maybe you are trying to perform some data analysis to support a data-driven decision. You might even be trying to find a publicly available data source to train and practice your skills or complete an assignment for a class.
Mountain From a Mole Hill
In today’s blog, I will be breaking down how to make a lot out of a little, and how to tell a story to support your business decisions. Back in December, Netflix posted their 2023 Netflix Engagement Report. Think Spotify Wrapped style, but Netflix also posted the Excel file of the data they used for their analysis in their report. While their report broke down the data a bit, I wanted to see what deeper insights were hidden within the data, as well as to create a neat data visualization dashboard.
If you were to download the data, you would see something like this:
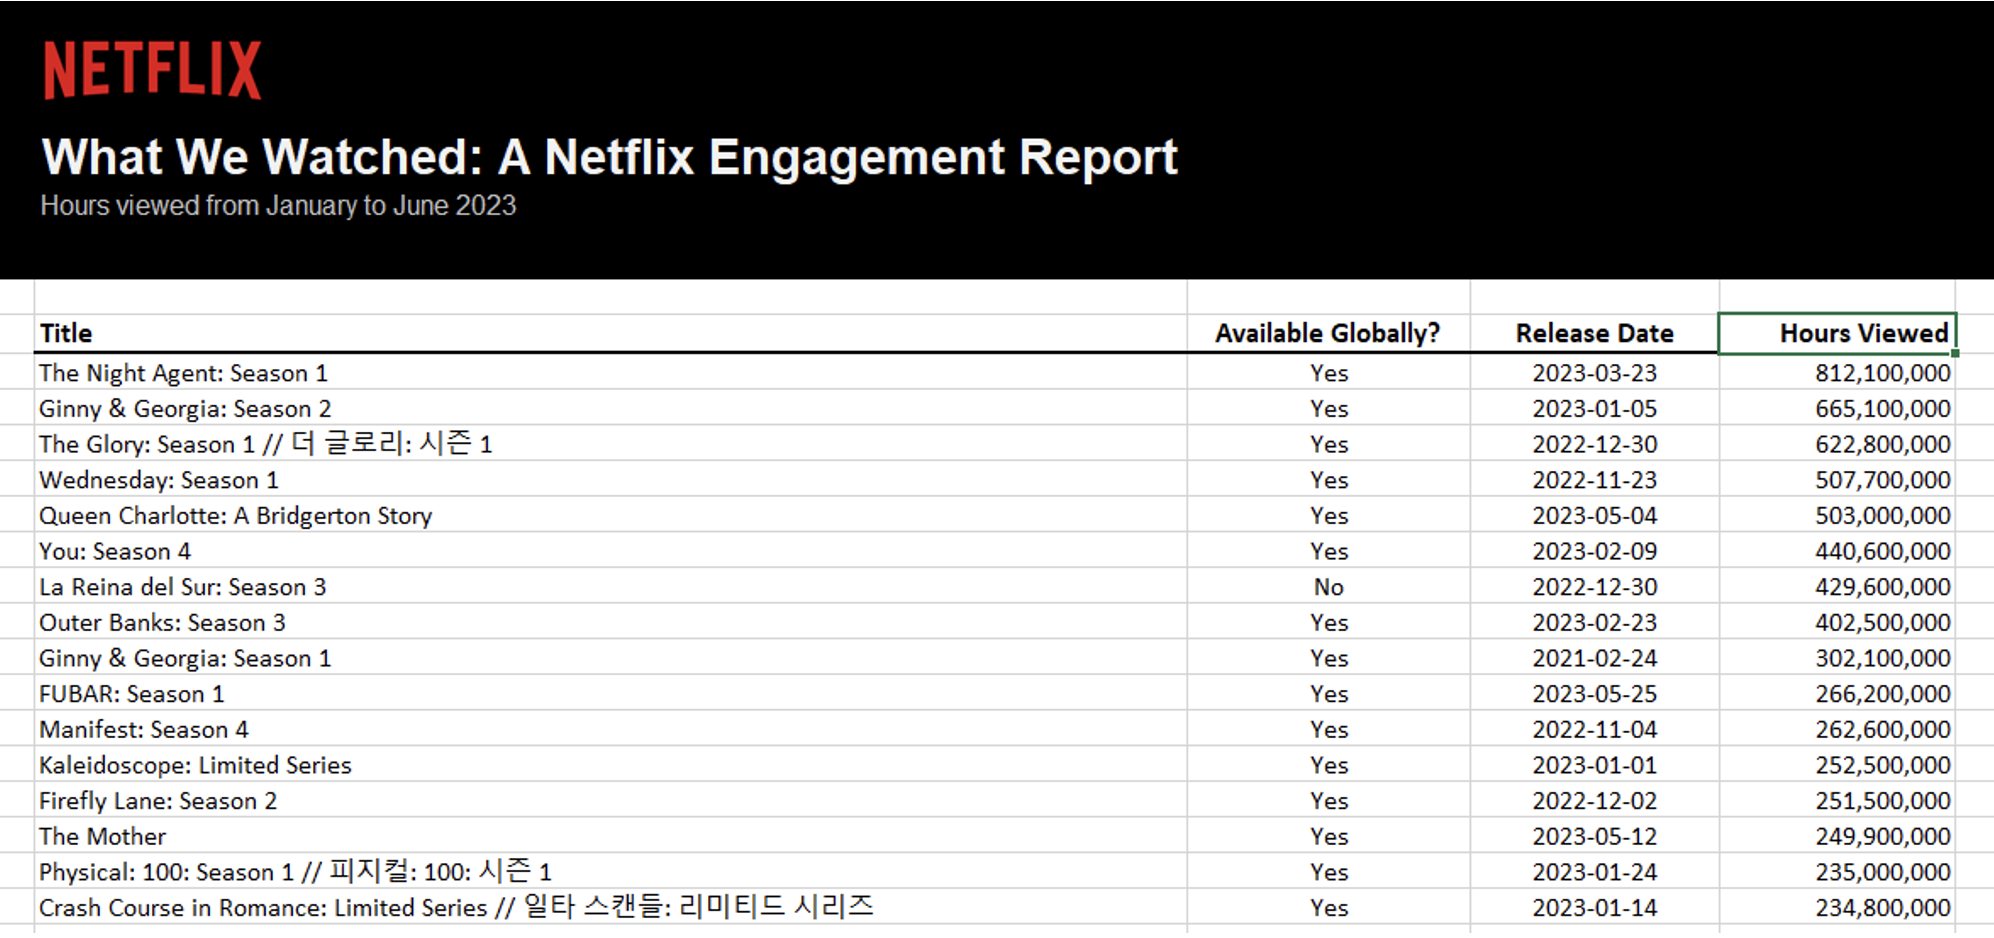
The dataset is simple with only four fields: “Title” (String), “Available Globally?” (Boolean), “Release Date” (Date) and “Hours Viewed” (Integer).
After looking at the dataset, I began asking myself some basic questions about possible questions I could answer, such as:
- TV show or movie?
- Global vs. not Global
- What content isn’t available globally that people are missing out on?
- Total Shows
- Total Movies
- Line chart of release date
- Number of shows vs. movies
- Total hours viewed
- Shows with multiple seasons watched this year
- How seasons compare vs. each other for multi season shows
- Shows released this year (shows vs. movie breakdown)
- Percent of shows available globally
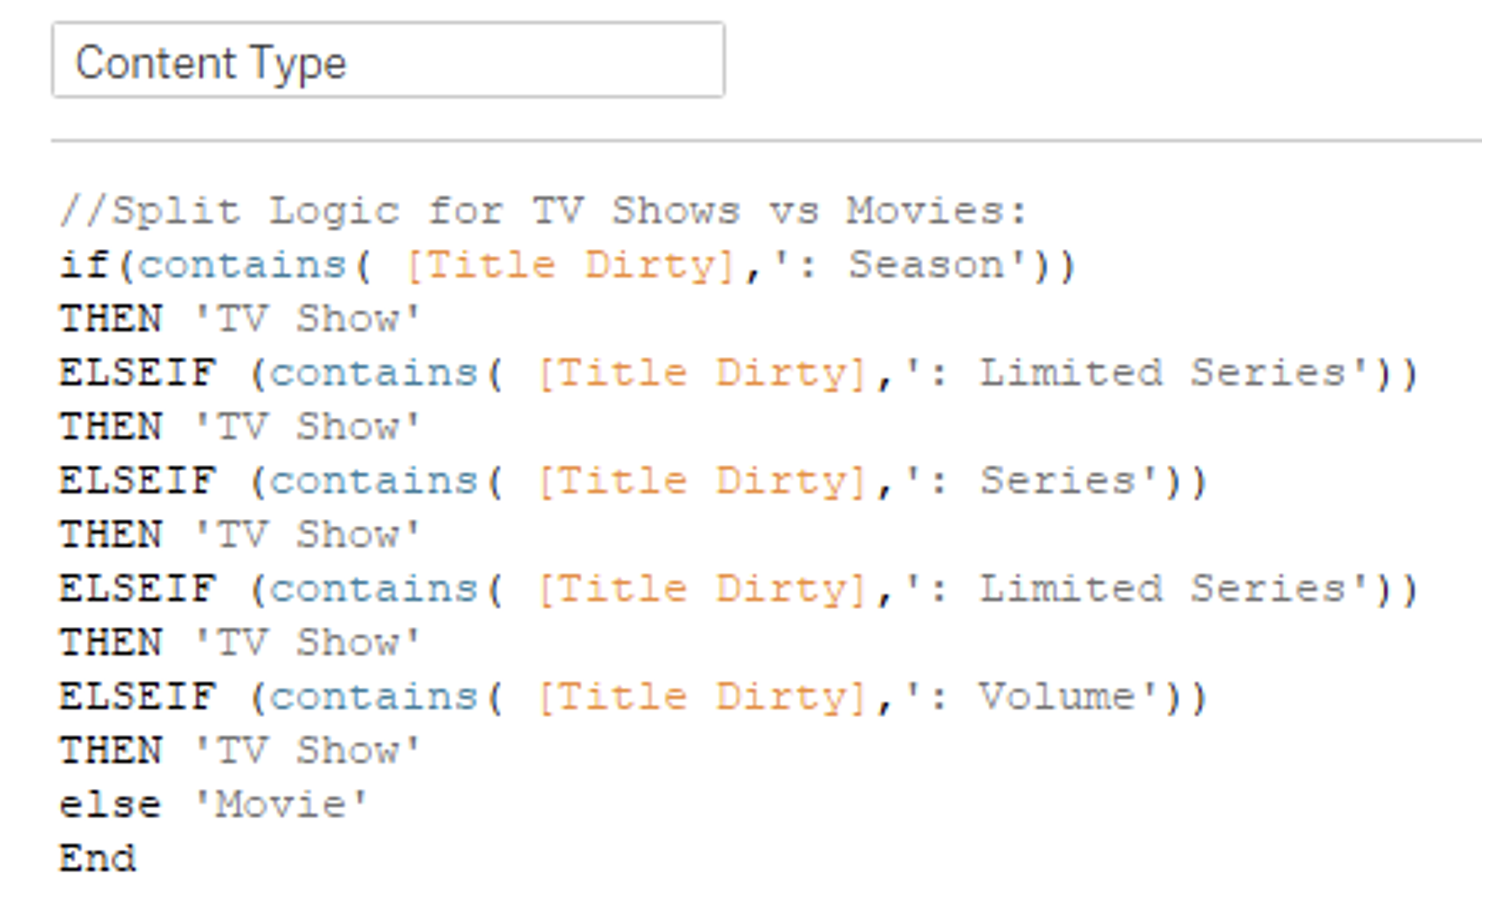
After brainstorming how I wanted to approach these questions, I knew I would have to begin by doing some basic data cleaning and making some assumptions. Since I wasn’t given a column of whether each title was a movie/TV Show, I created a simple calculated field called “Content Type” to assign the designation. While impossible to ensure that I was able to perfectly assign each row unless I did it manually, this framework seemed to catch the majority:
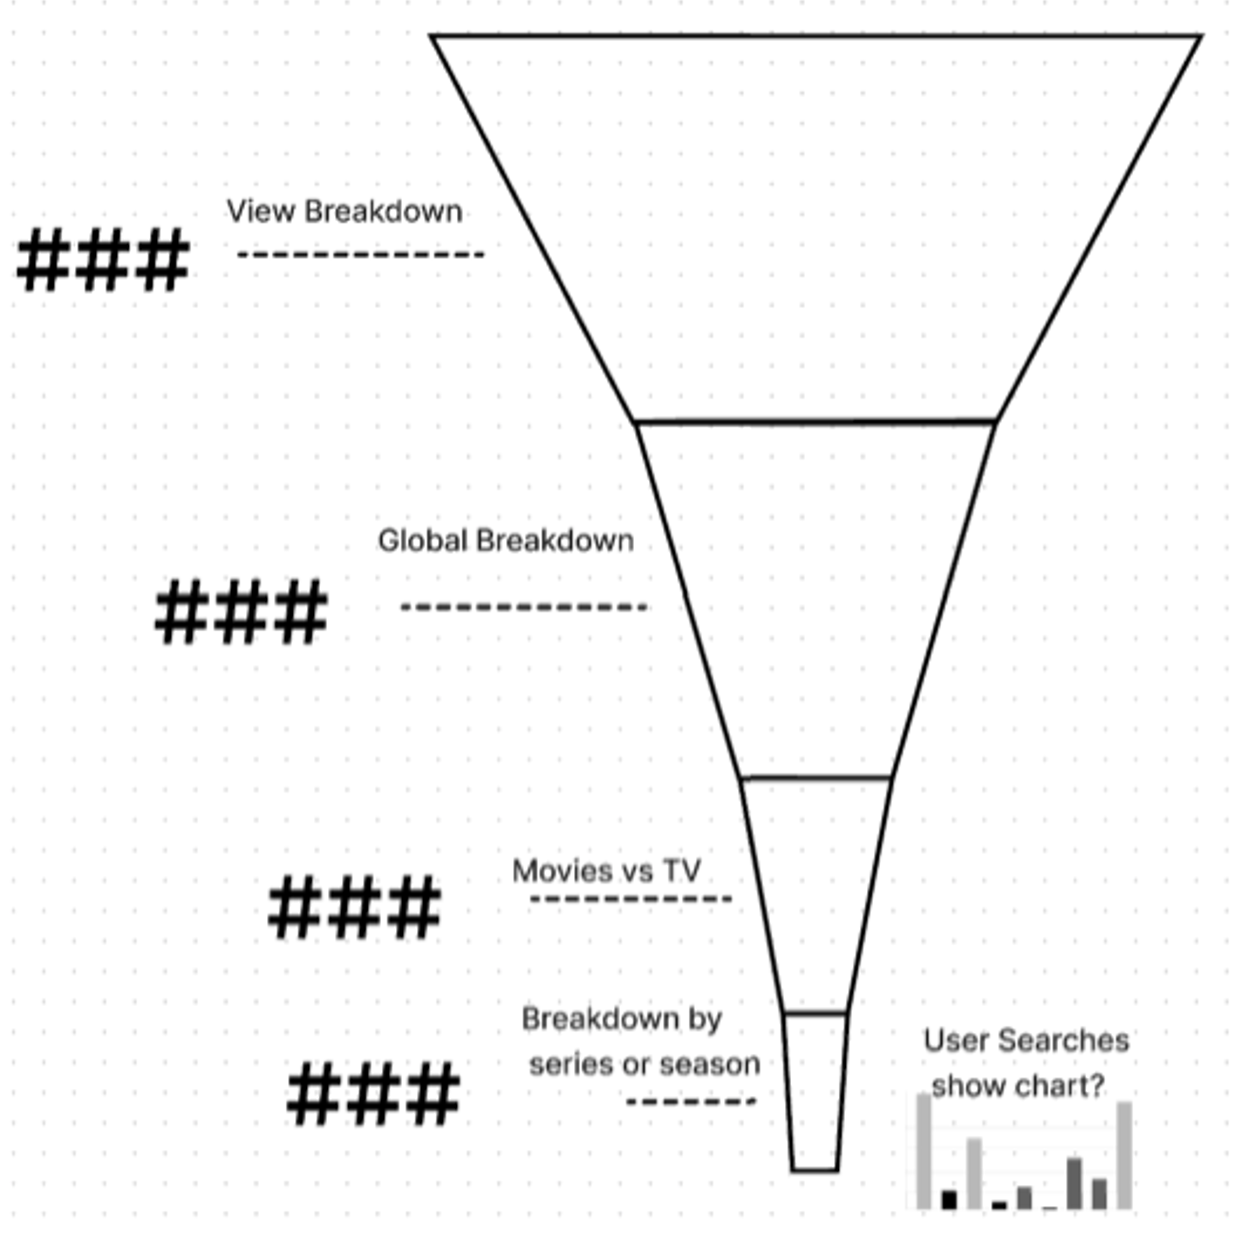
From there, I had most of the data structure that I would need to answer some of my questions. I decided to tell my story through a one-pager style dashboard that is embedded at the bottom of this blog. From top down, I wanted to start with a 40,000-foot broad lens of the data and some summary statistics before diving into more specific questions. To get my thoughts out on paper, I did a bit of wireframing in FigJam. As you can see in the funnel below, I would break down the Engagement Report by category and brainstormed some chart types I might use:
With the funnel down, I moved on to wireframing the actual dashboard (which you’ll see in more detail down below):
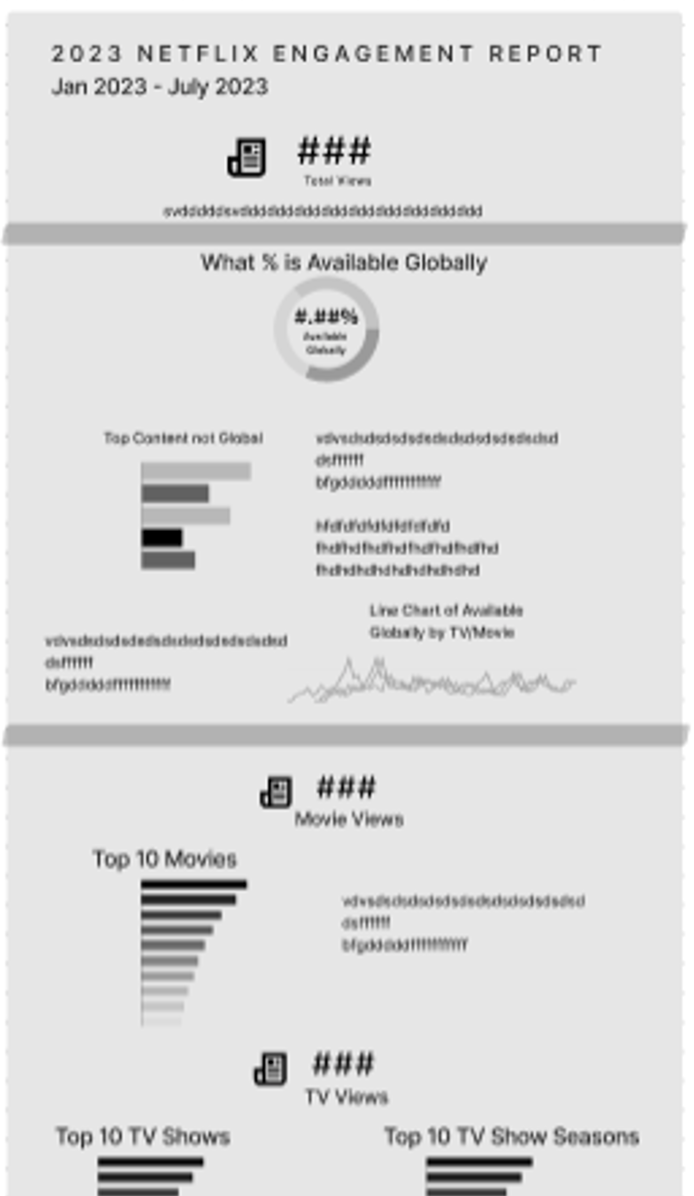
After creating the base architecture for my dashboard, I hopped back into Tableau and began creating my charts and graphs:
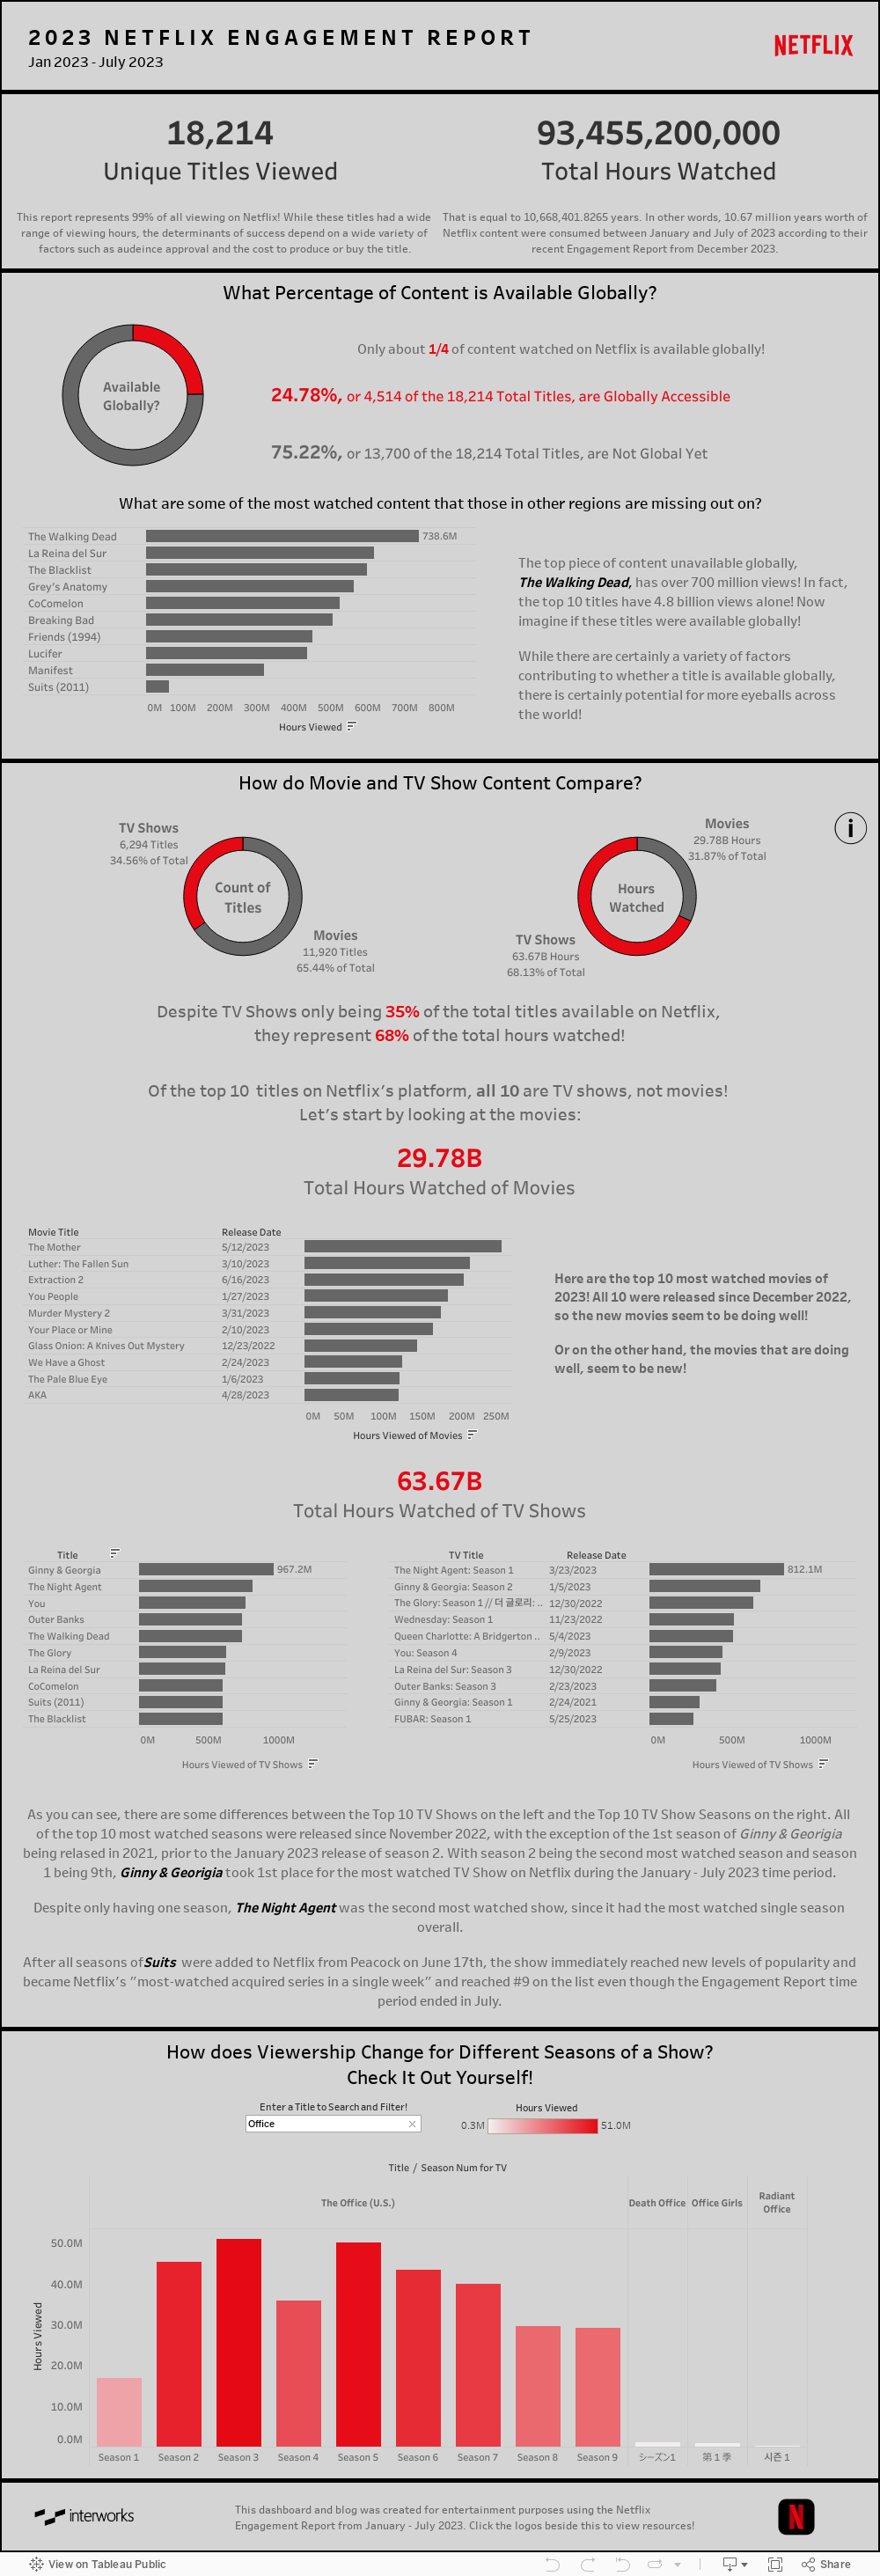
And viola! There she is. If you ever need help spinning gold from thread, or just want to know how we can help you clean your data, just hit us up here and we’ll do the rest!