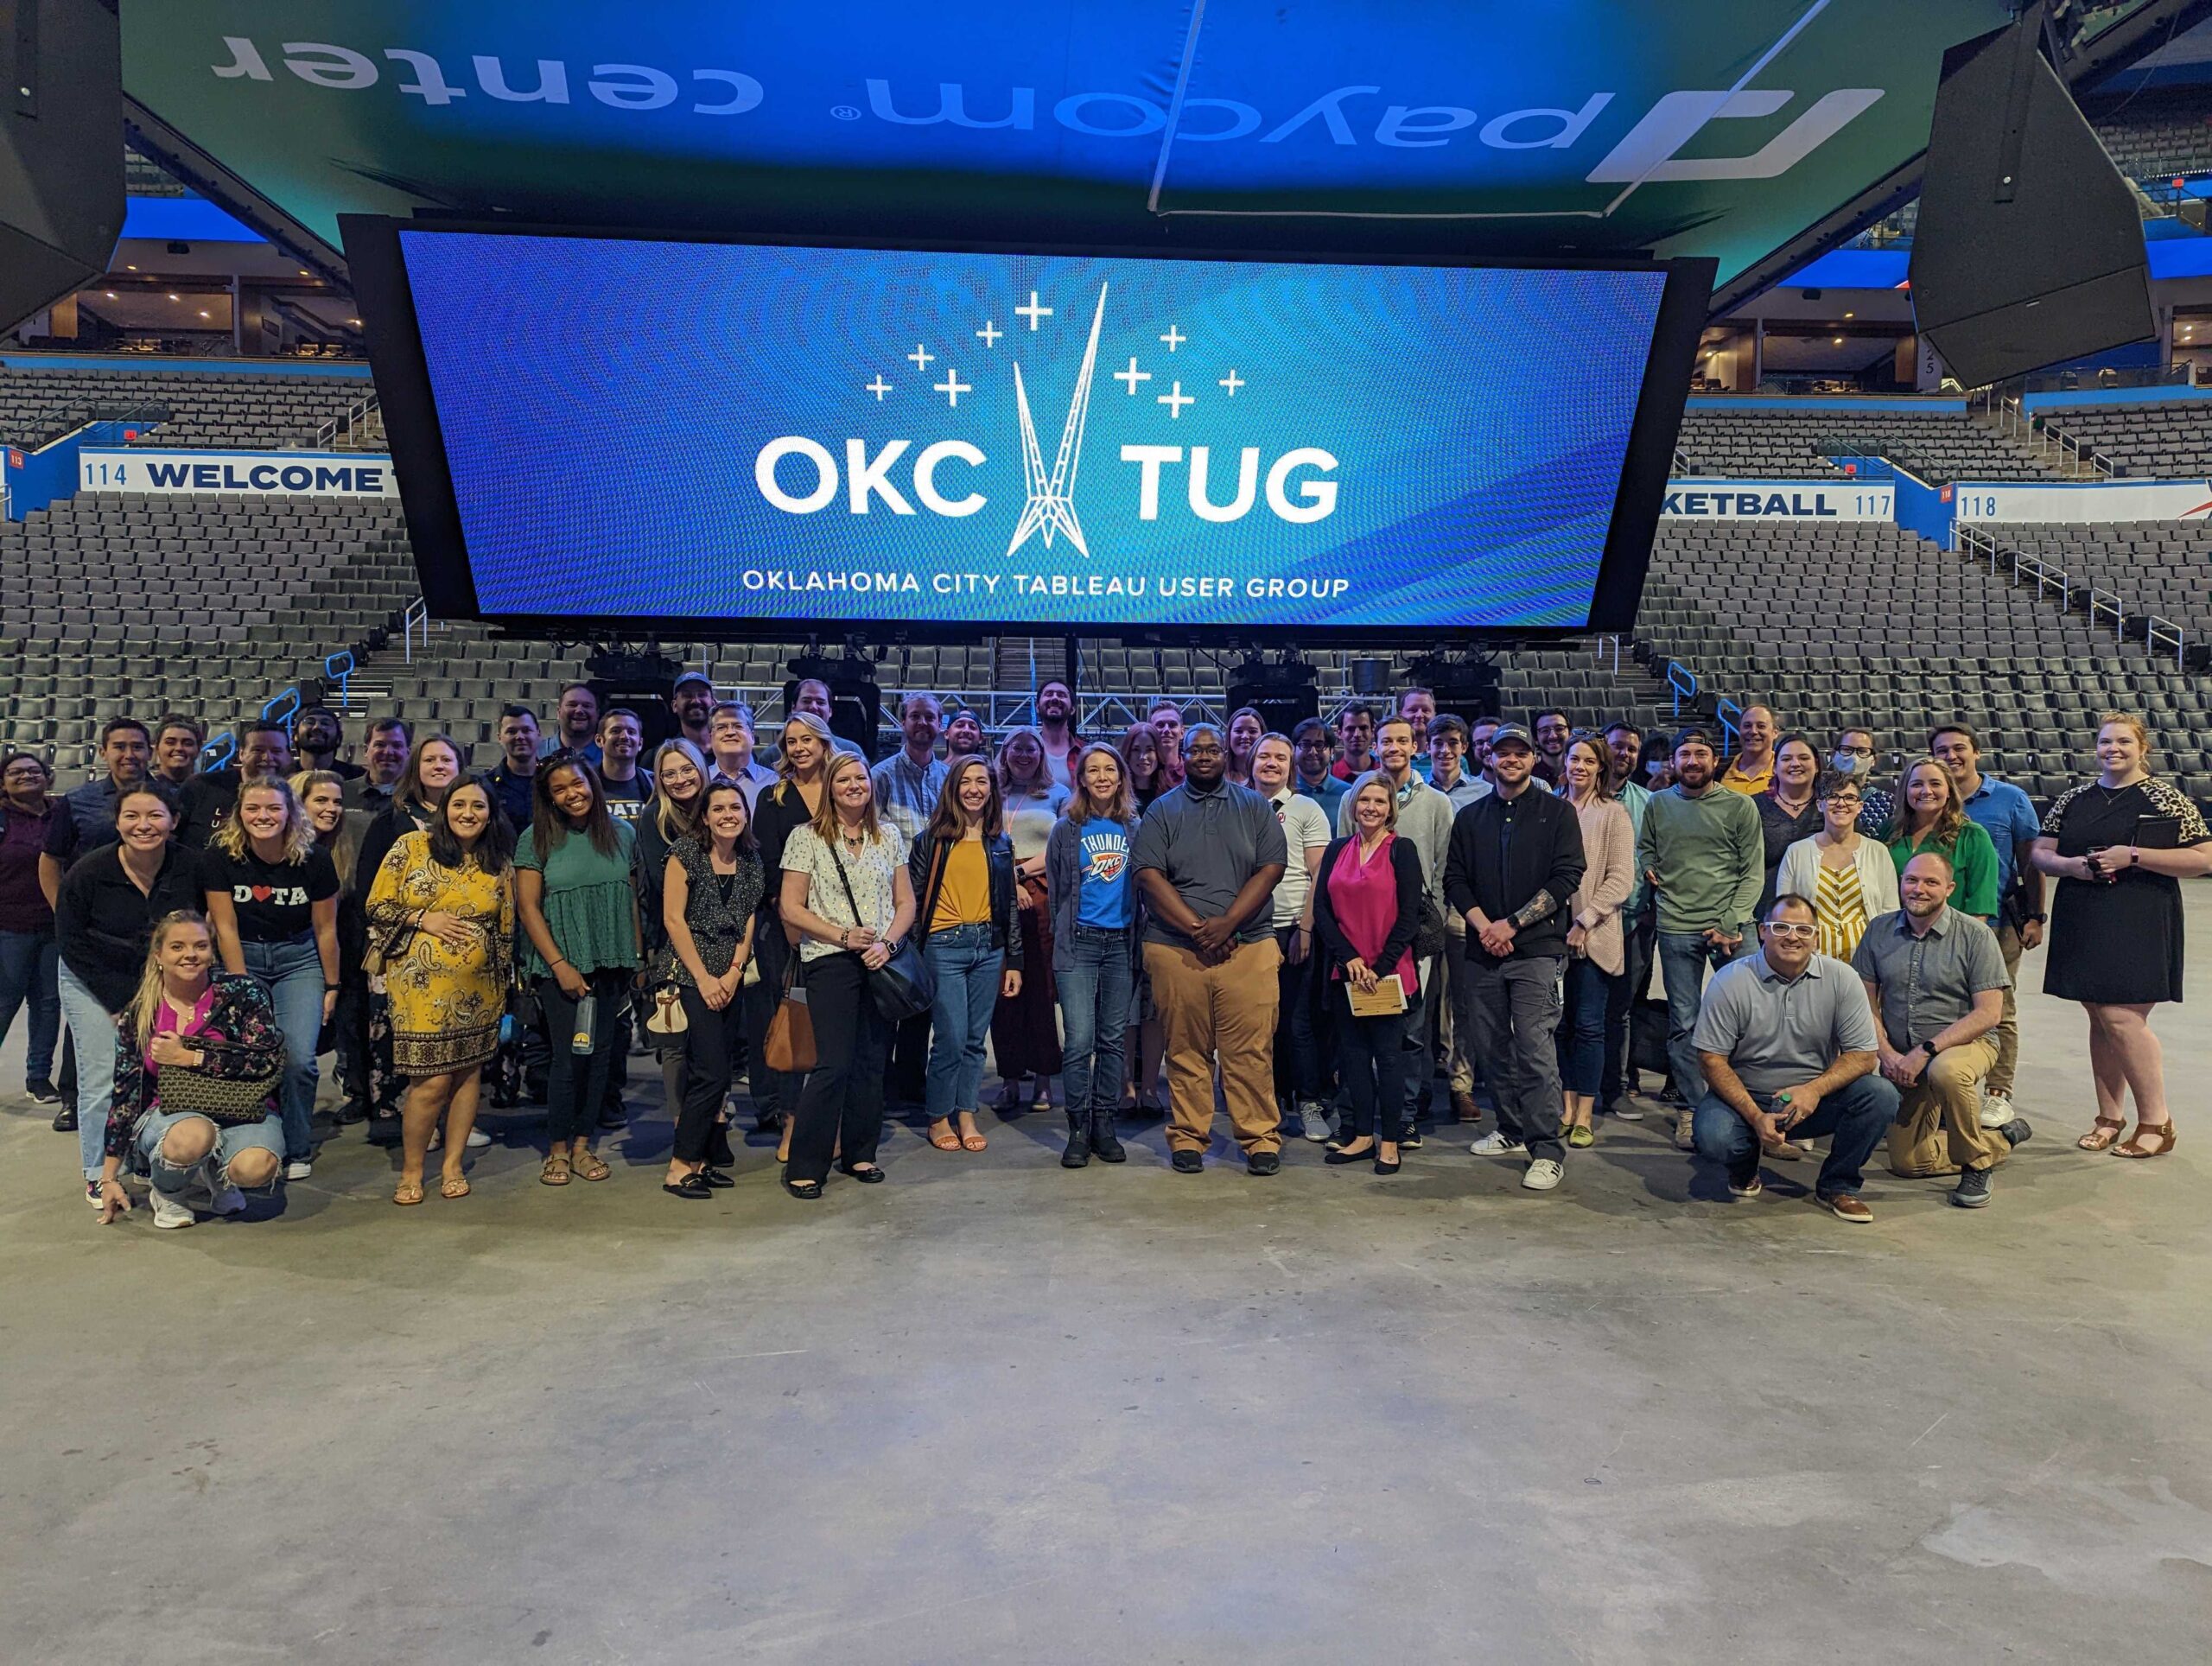
About two weeks ago, the Oklahoma City Thunder hosted the first meeting of the Oklahoma City Tableau User Group in nearly three years! Like many other user groups, regular meetings were put on hold during the bulk of the COVID pandemic. The recent meeting brought together 65 connections, old and new, breathing new life into Oklahoma’s growing user group.

Above: The OKC TUG back in force at Paycom Arena.
Planned and Presented by the OKC Thunder
The idea to spark up the OKC TUG started with the OKC Thunder. One day, not too long ago, OKC TUG Leader and InterWorks Analytics Consultant Sean Spencer received an email from Danielle Brown, Manger of CRM and Email Marketing for the OKC Thunder, about planning the next meeting.
“When Danielle emailed me, she essentially said the Thunder would love to host, deliver all the content and buy lunch for all the attendees … oh, and give everyone a full arena tour of the Paycom Center. They pretty much took care of everything, and our role at InterWorks was to help them get the word out and re-engage with our contacts in OKC and Tulsa.”
– Sean Spencer, Analytics Consultant, InterWorks
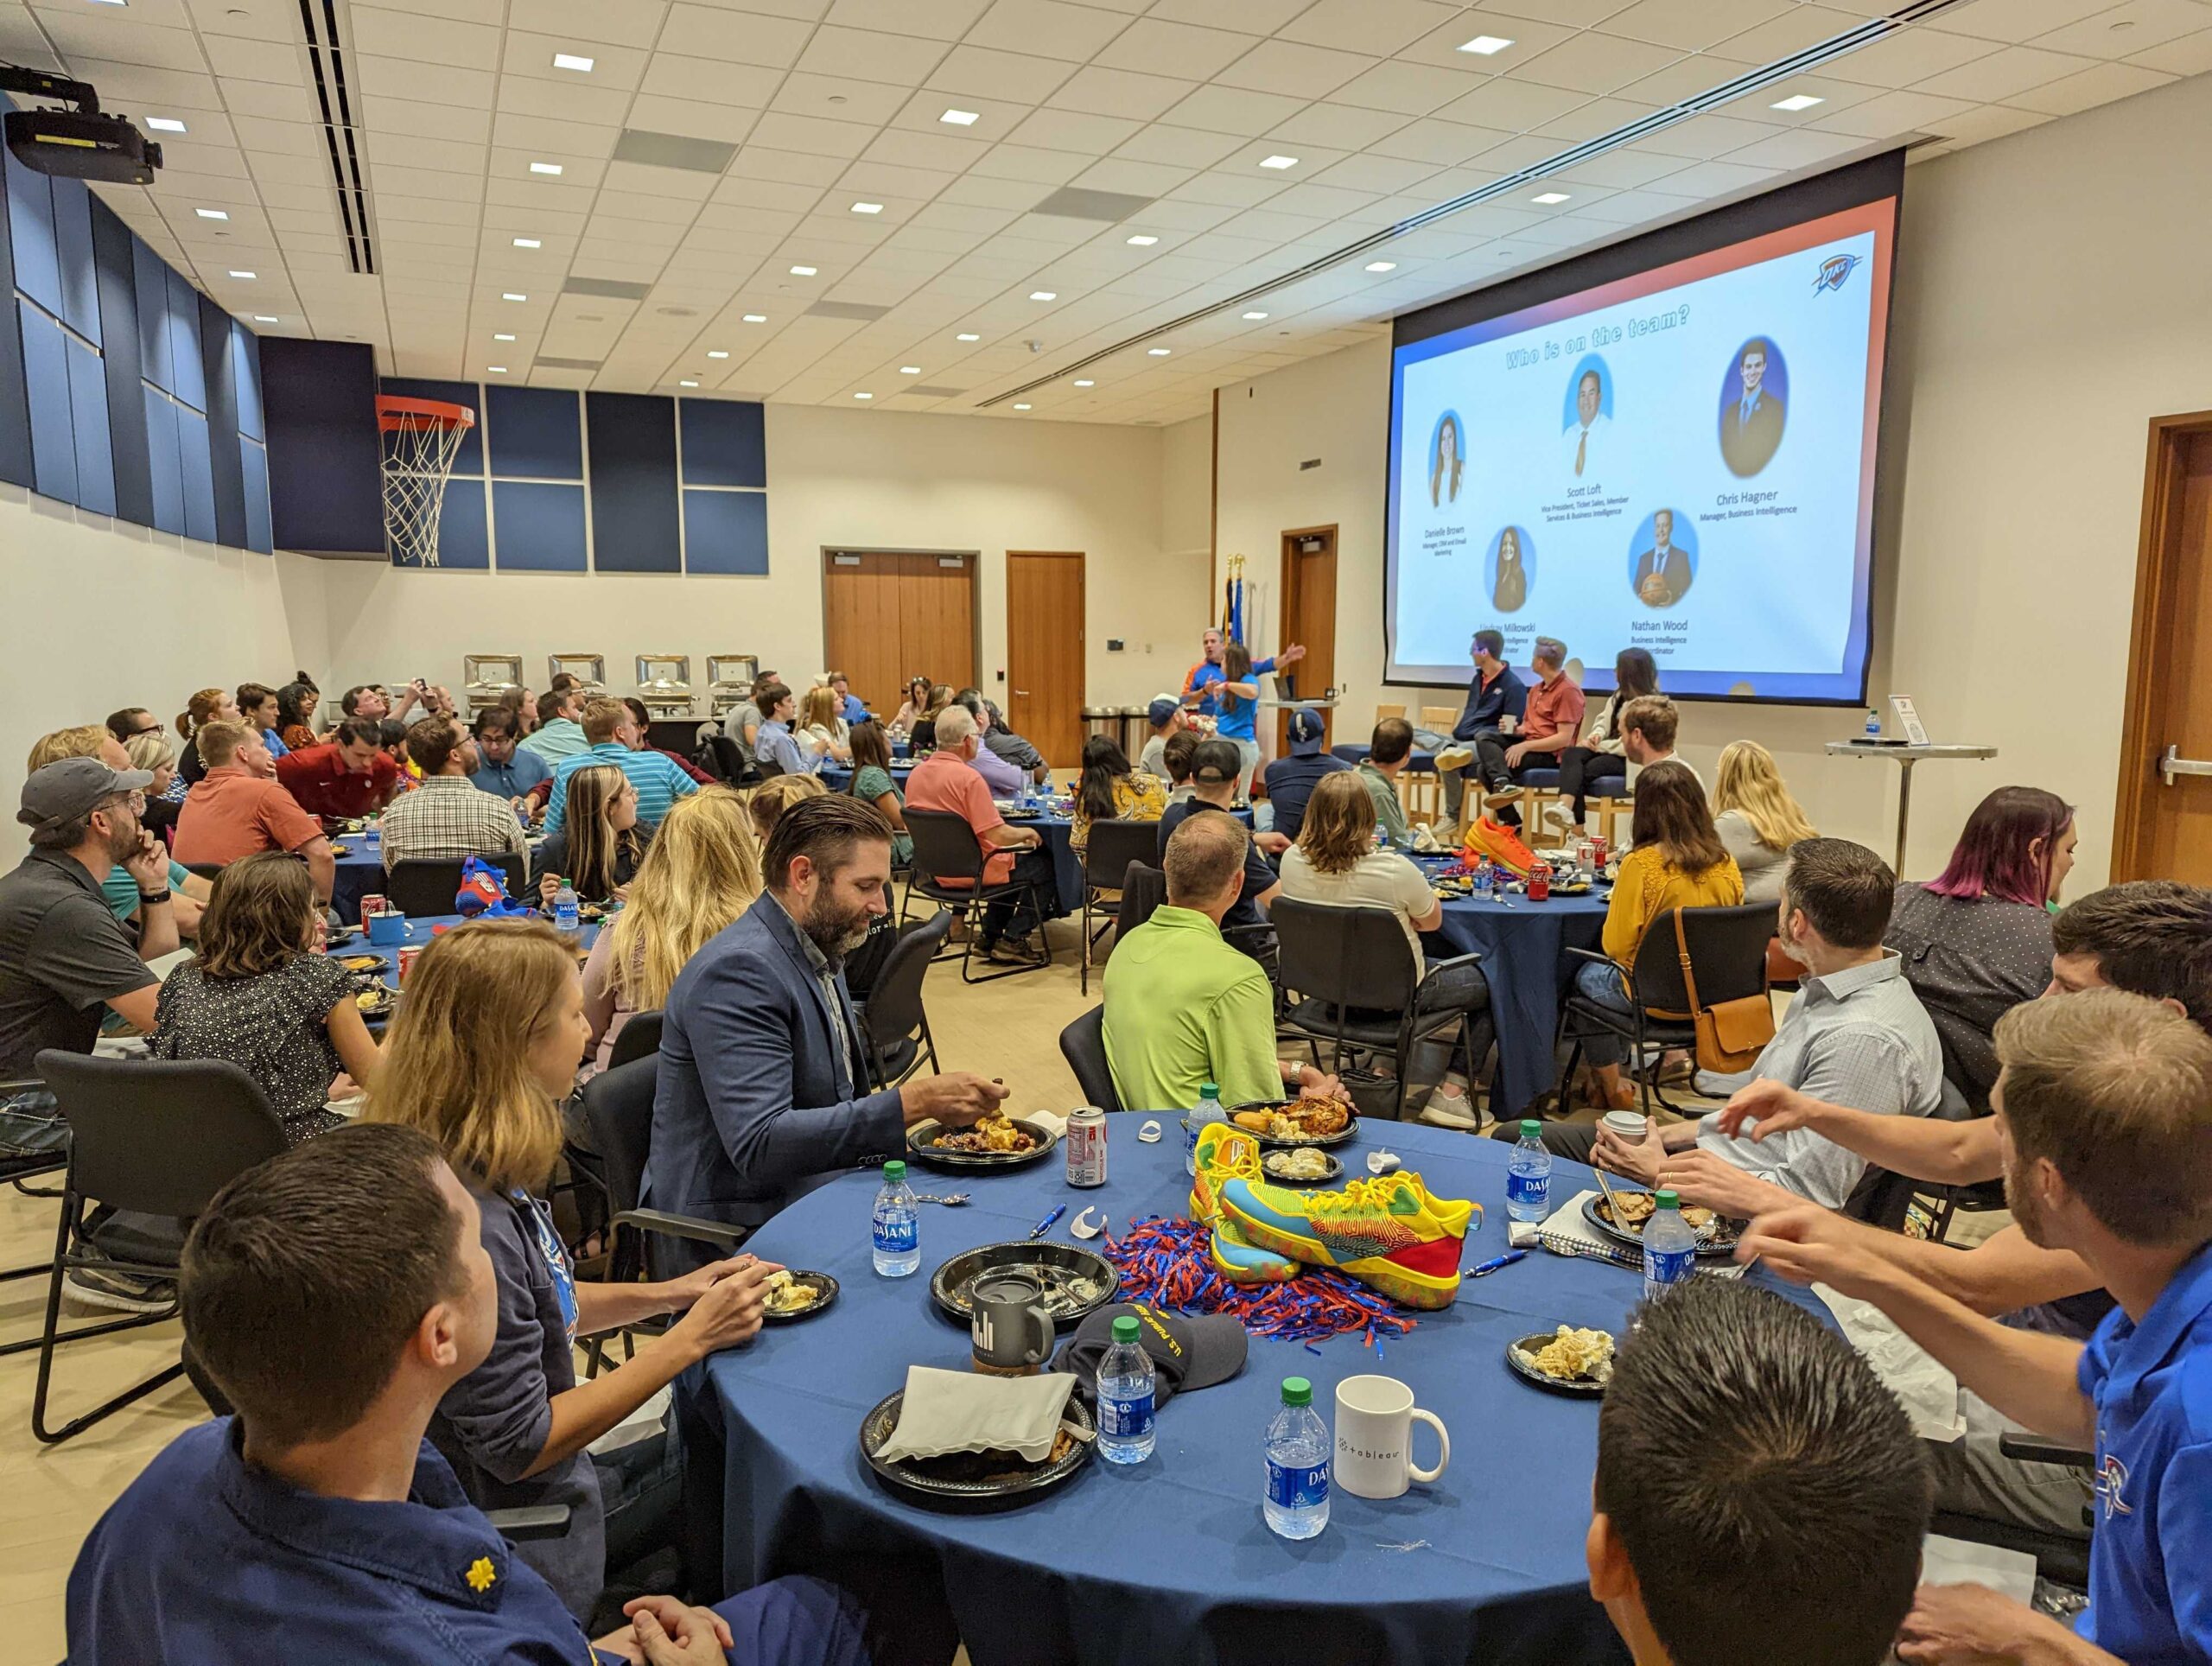
For the presentation portion of the TUG meeting, several leaders from across the OKC Thunder shared the fascinating work they’ve been doing in Tableau over the past few years. Presenters included:
- Danielle Brown, Manager, CRM & Email Marketing
- Scott Loft, VP, Ticket Sales, Member Services & Business Intelligence
- Chris Hagner, Manager, Business Intelligence
- Lindsay Milkowski, Business Intelligence Coordinator
- Nathan Wood, Business Intelligence Coordinator
Danielle Brown and Lindsay Milkowski focused their presentation on their evolving customer and email analytics strategies, showing the role Tableau plays in helping to synthesize insights and metrics from those channels.
Chris Hagner and Nathan Wood focused on an interesting use case for Tableau where they are able to map X and Y coordinates for individual sets within the Paycom Center, as well as vendor locations. The insights are so fine grain that they can now determine which matchups sell more food items like hot dogs and where within the arena those items sell best.
Scott Loft rounded out the presentations with great perspective on how Tableau has helped transform how they communicate insights to board members using Tableau, resulting in better decision-making all around.
The TUG event concluded with the arena tour, where the OKC TUG logo was projected up on the big screen. Attendees got a full rundown of arena operations. All attendees received two tickets to the Thunder’s season opener, and there was even a raffle for signed player photos.

Above: Great presentations from across the OKC Thunder’s team.
A Great Refresh for the OKC Tableau Community
Overall, the event was a smashing success. So much credit goes to the Thunder for taking on responsibility for the entire event, and what better way to reinvigorate the Tableau community than through shared fandom of the local team AND some really cool examples of Tableau work. The only problem? Everyone is simply ready for more!
“One thing I noticed about the vibe of this event was that everyone was so excited to reconnect and chat, and not just about analytics but about life in general. People continued chatting well after the event was over. It honestly felt like high school, when you’re catching up with friends between class and don’t even hear the bell ring for your next period. Fortunately, nobody here got detention for being tardy, but it just shows how valued this community is among its members.”
– Sean Spencer, Analytics Consultant, InterWorks
With that, we’ll say a big thank you to the Thunder for putting on such a great event. A big thank you also to everyone who showed up and made it a hit! If you’re a Tableau user in OKC or Tulsa (or really anywhere across the state), we encourage you to join us for the next meeting of the OKC Tableau User Group. We’ll keep you informed!

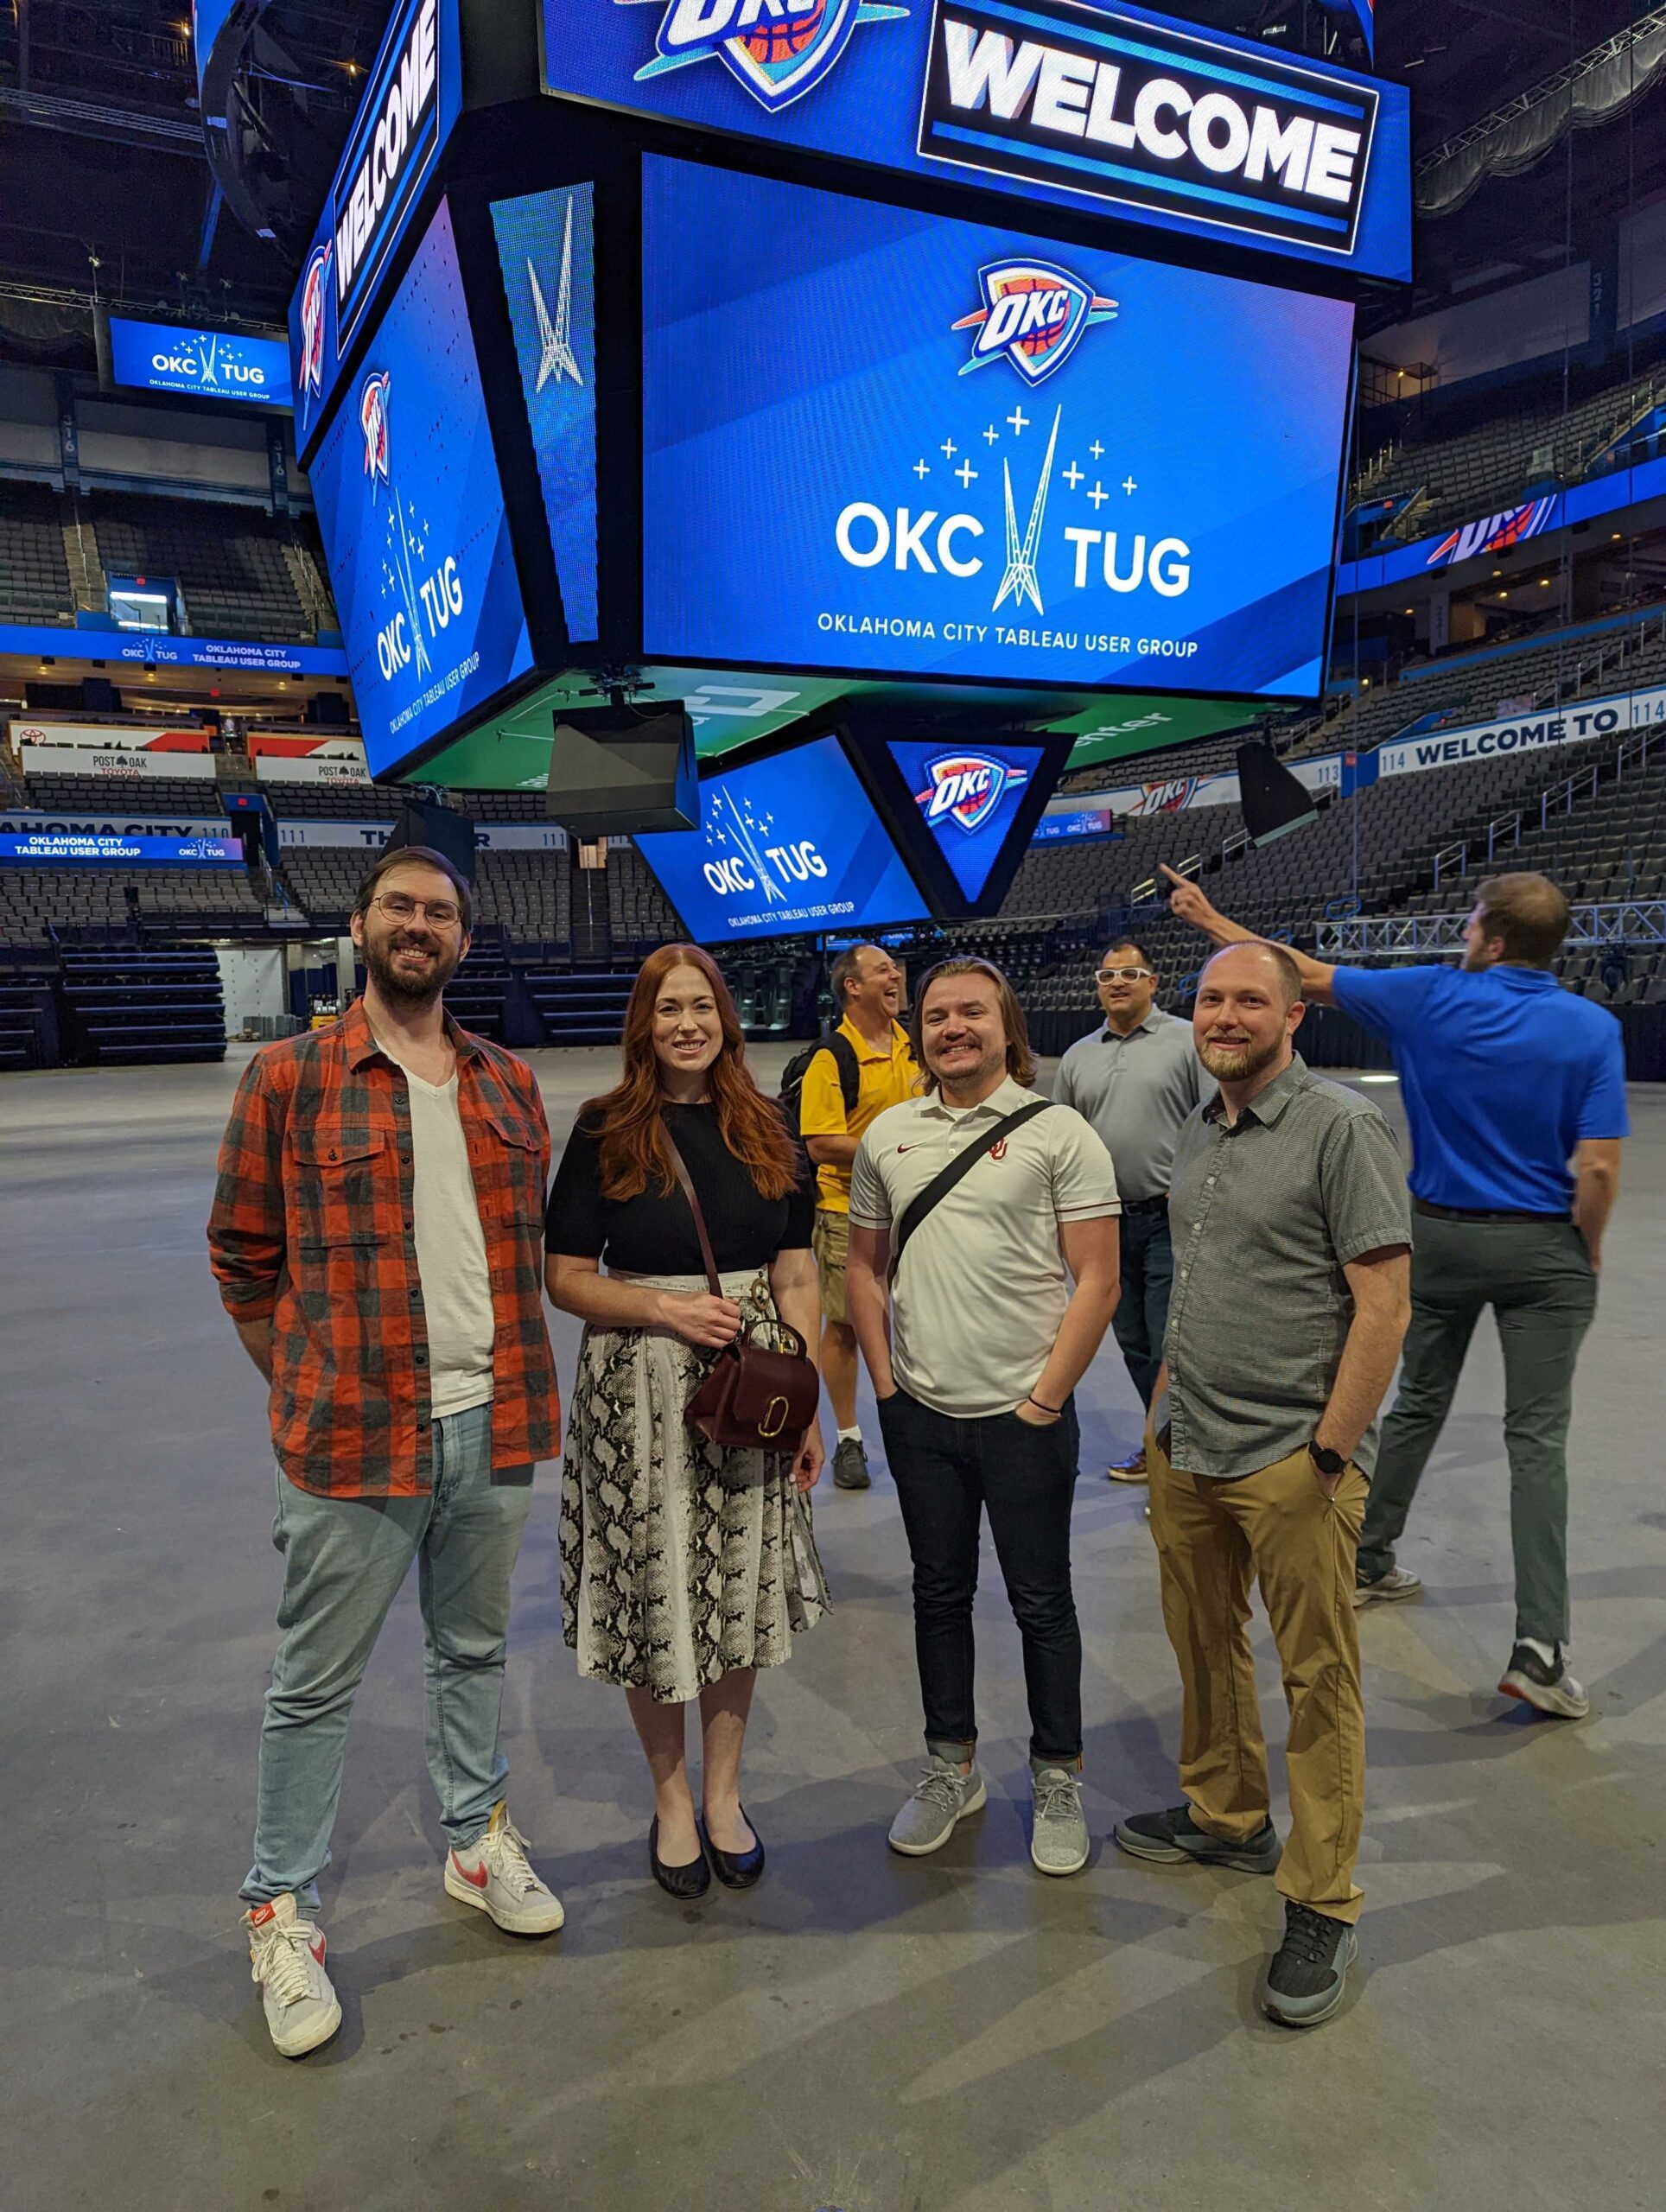
Above: OKC TUG leaders Sean Spencer, Christin Bivens, Matthew Welborn and Kent Sloan.


