This series focuses on our partnership with ThoughtSpot, its valuable data solutions and the value we provide to clients as a team.
Welcome to part two of our opening ThoughtSpot blog series at InterWorks! If you missed the first post, that’s the best place to start.
Now that you’re all caught up, I’d like to take time today to review the ThoughtSpot “hierarchy of things” as I like to call it, that we find in the platform. I will not be talking about anything in the data or metadata layer; that’s the next blog entry. ThoughtSpot has three basic building blocks to their experience:
- SEARCH
- ANSWERS
- LIVEBOARDS
If you get nothing else out of this blog, then know this: Searches are the starting point in ThoughtSpot. You search for an answer in your data. Answers are just saved search results. Then you compile answers together to make a liveboard for quick access to commonly accessed searches and KPIs. Liveboards are not dashboards in the way you may understand a dashboard to be, but they can feel and interact in dashboard-like ways.
To make it even simpler: SEARCHES create ANSWERS. ANSWERS create LIVEBOARDS.
Start with a Search
Everything in ThoughtSpot starts with a search:

The landing page on ThoughtSpot Cloud puts a search bar (much like Google or any other internet search engine) right at the top, practically begging the user to start looking.
This search bar will let users search across all the things they have access to in ThoughtSpot, including answers, liveboards, data objects, etc. It’s a very robust and powerful tool to get a user quickly into the data they need to access. If a user is more experienced, the Search Data button will take them straight into the search interface:
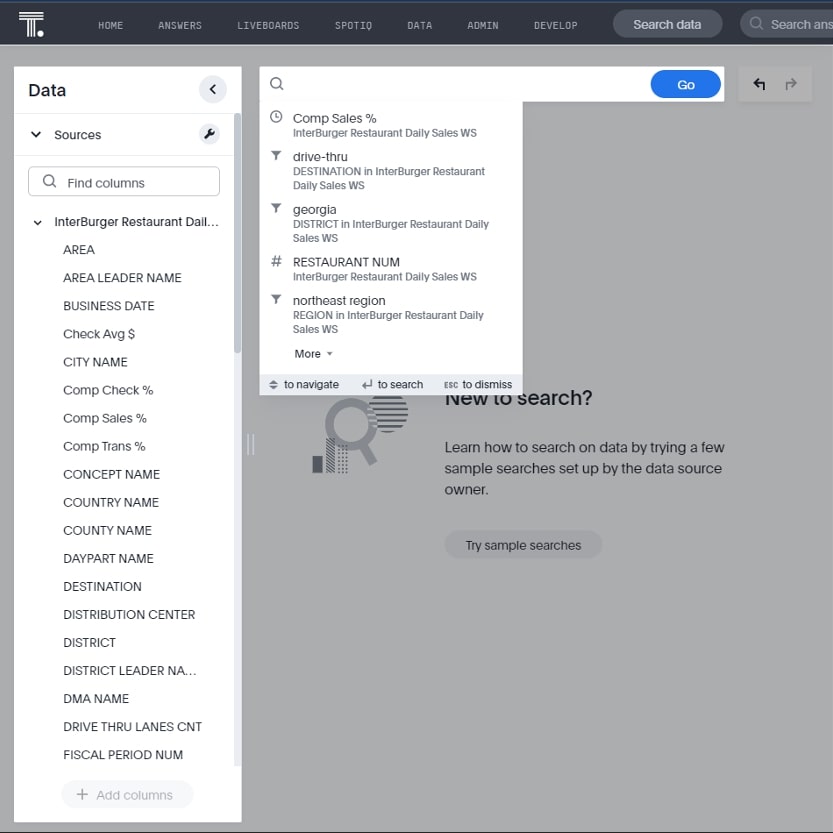
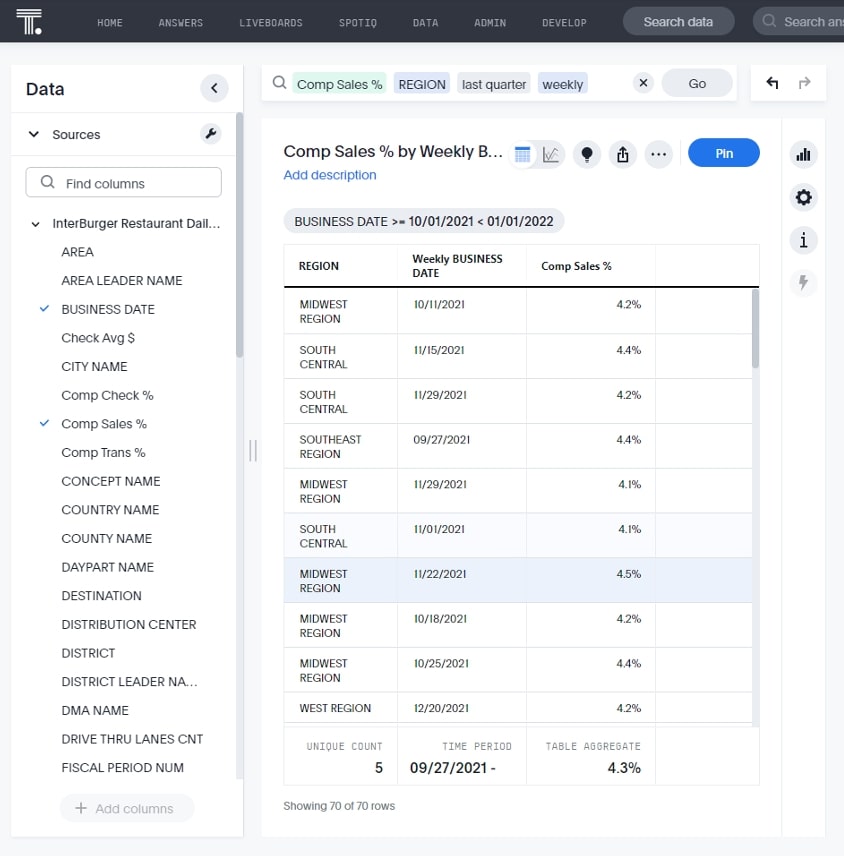
In this example, I will type in Comp Sales, Region, last quarter and weekly, and I get a line graph of weekly comp sales % by region for the last quarter:
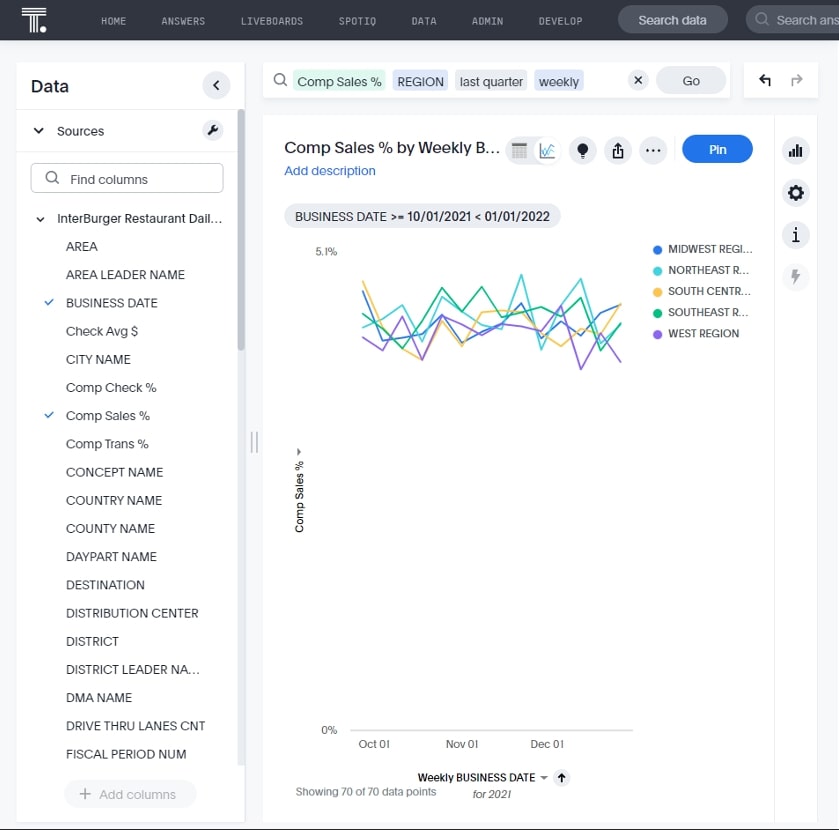
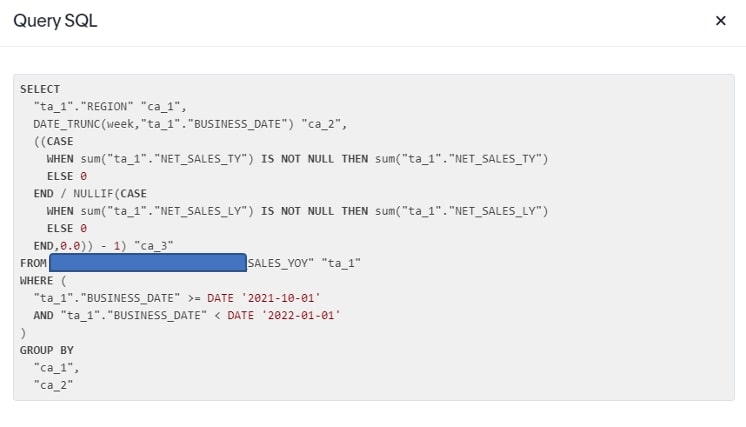
This is how easy a search is in ThoughtSpot. Much like when we google for something and get a list of answers, ThoughtSpot queries my database (see SQL below) and returns this visual. I now have a few decisions to make. I can:
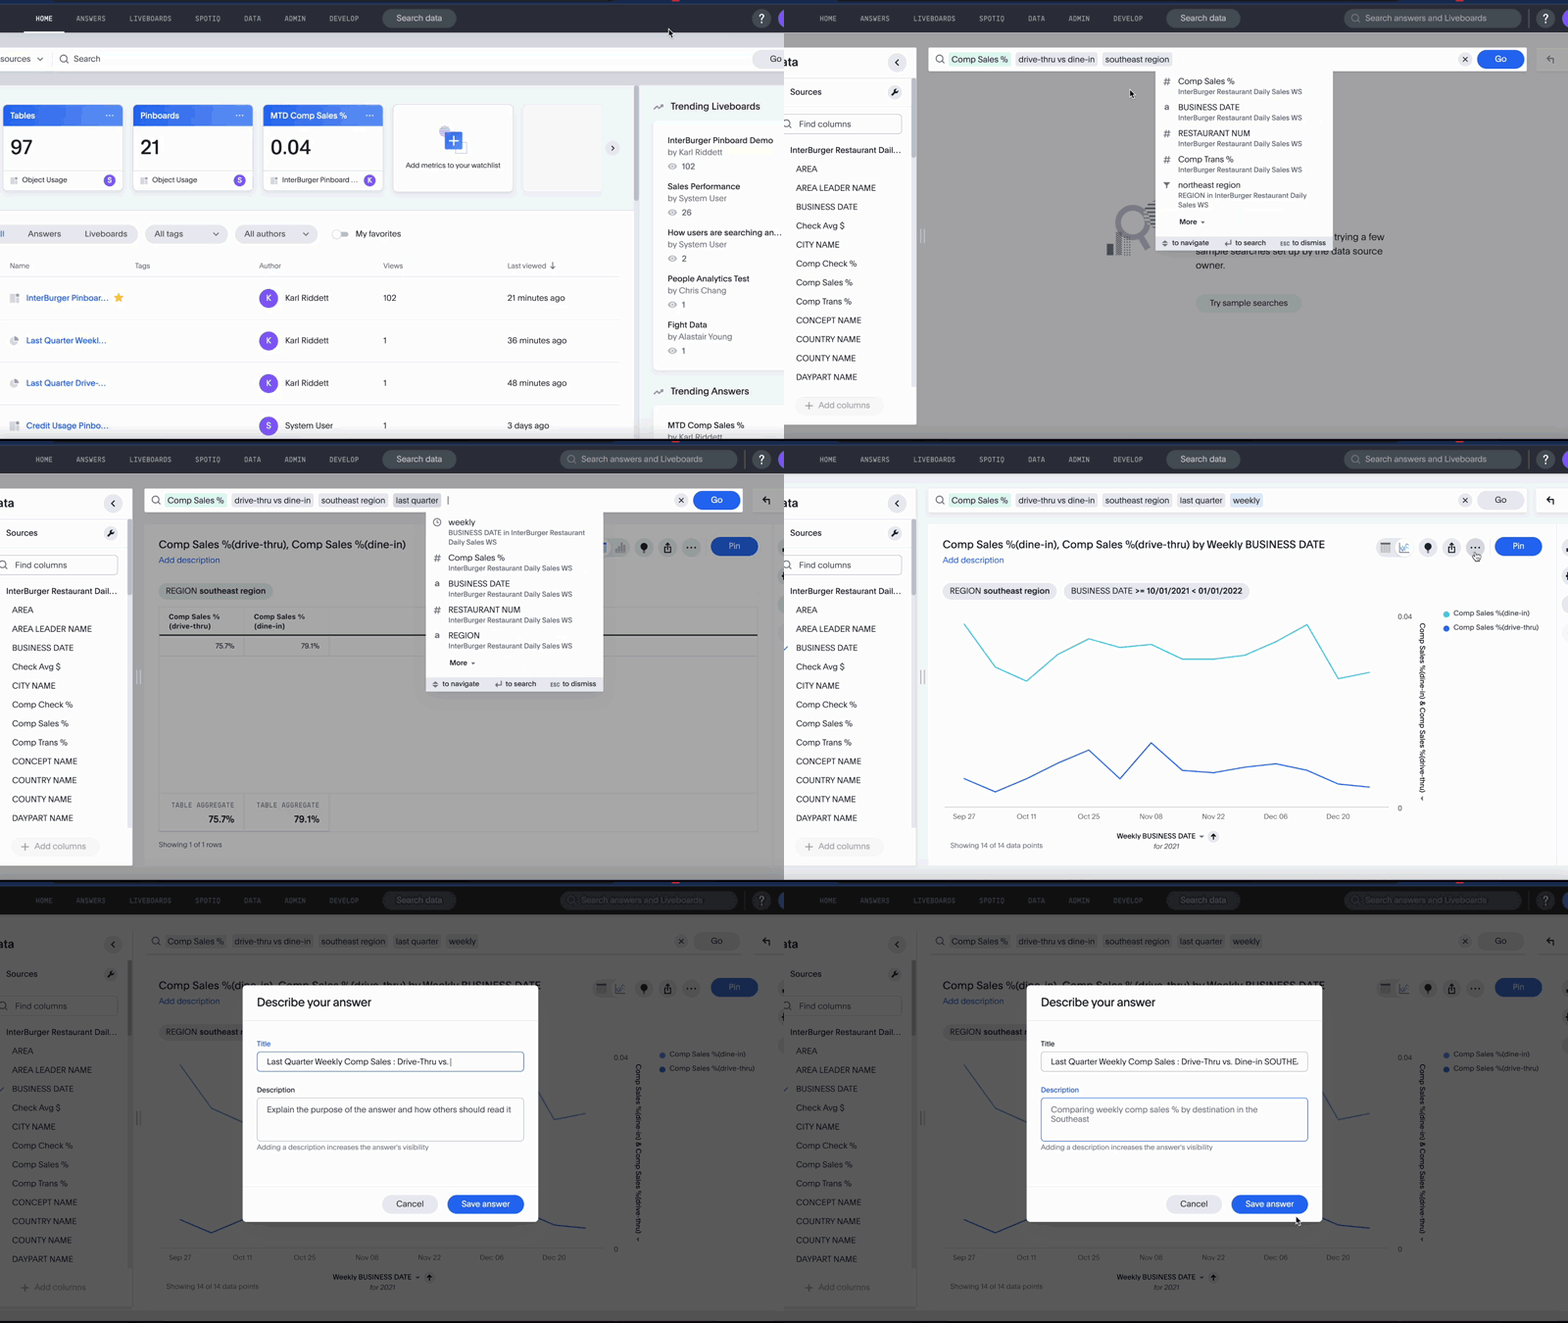
1. Make modifications to my search by adding additional fields. Here, I added the destination drive-thru:

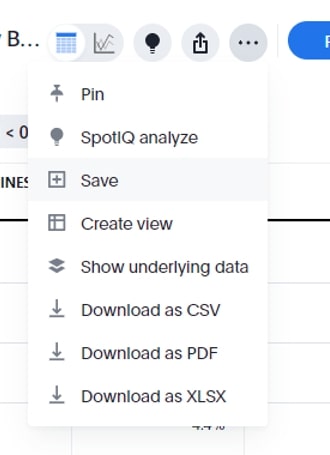
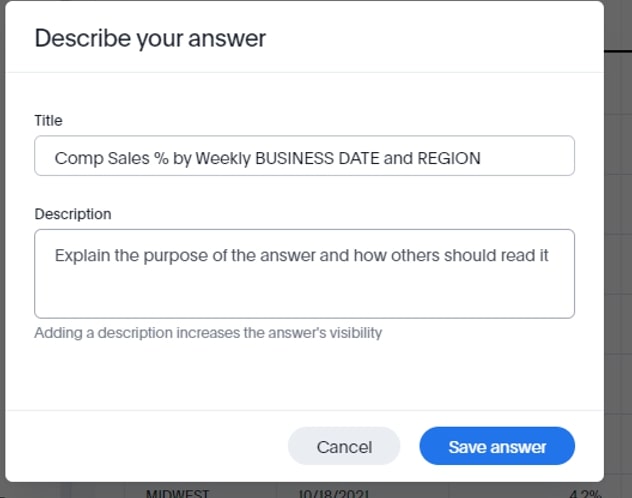
2. Save this search as an answer:
3. Make modifications by changing the visualization type. Here, I clicked on the Data Table button and made a crosstab:
4. Clear results and start over. Here is the SQL I executed:
Search is such a powerful way to do ad hoc analytics or to answer a question of your data when a dashboard or report isn’t available to answer it. Search is also a great mechanism for increasing data literacy of your organization and helping more non-technically savvy users to begin leveraging self-service business intelligence.
Searches Lead to Answers
Let’s say you find a search result and you really like it, or it’s the answer you were either looking for or needed. You would want to save it then, correct? Enter answers. Saving a search turns it into an answer that can be viewed again on demand, pinned as a KPI or pinned onto a liveboard:
Answers can be shared with users and/or user groups, too:
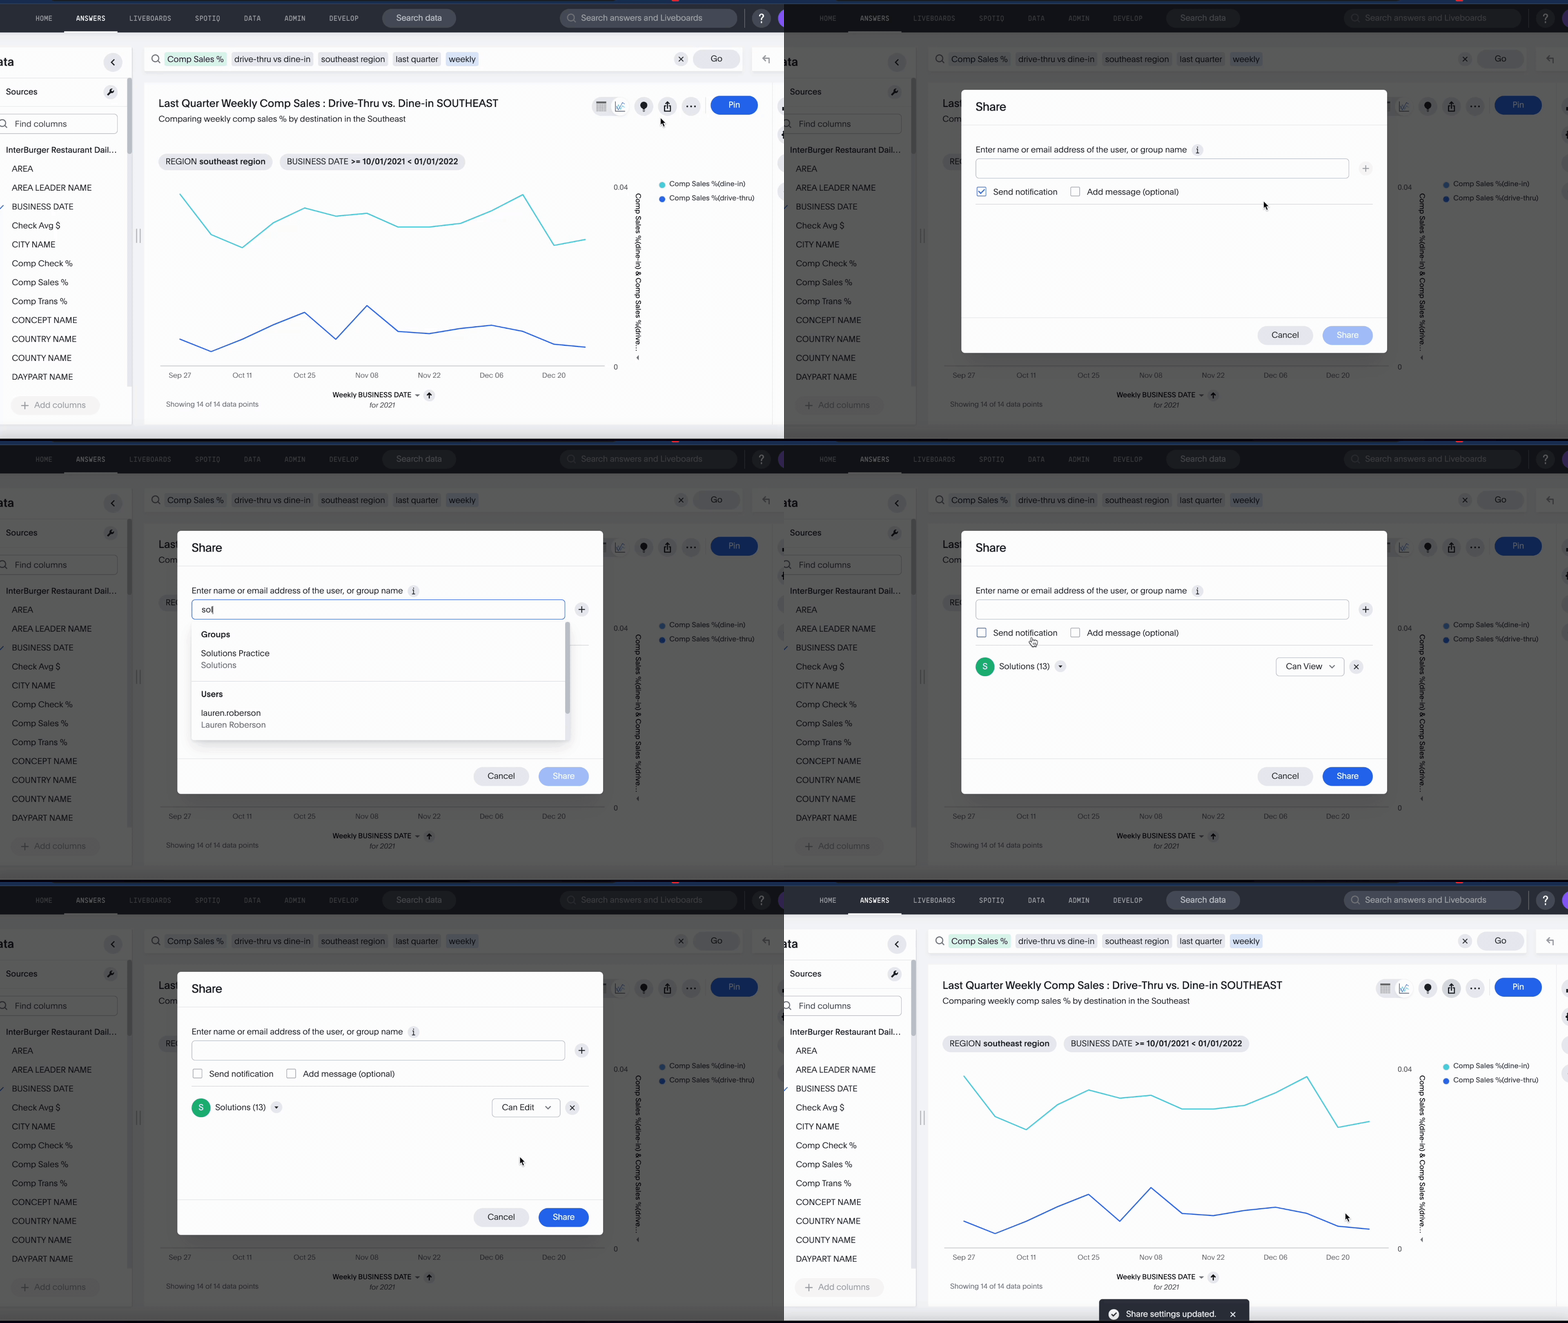
When you save an answer and share it, it then can be recalled on the main search screen:
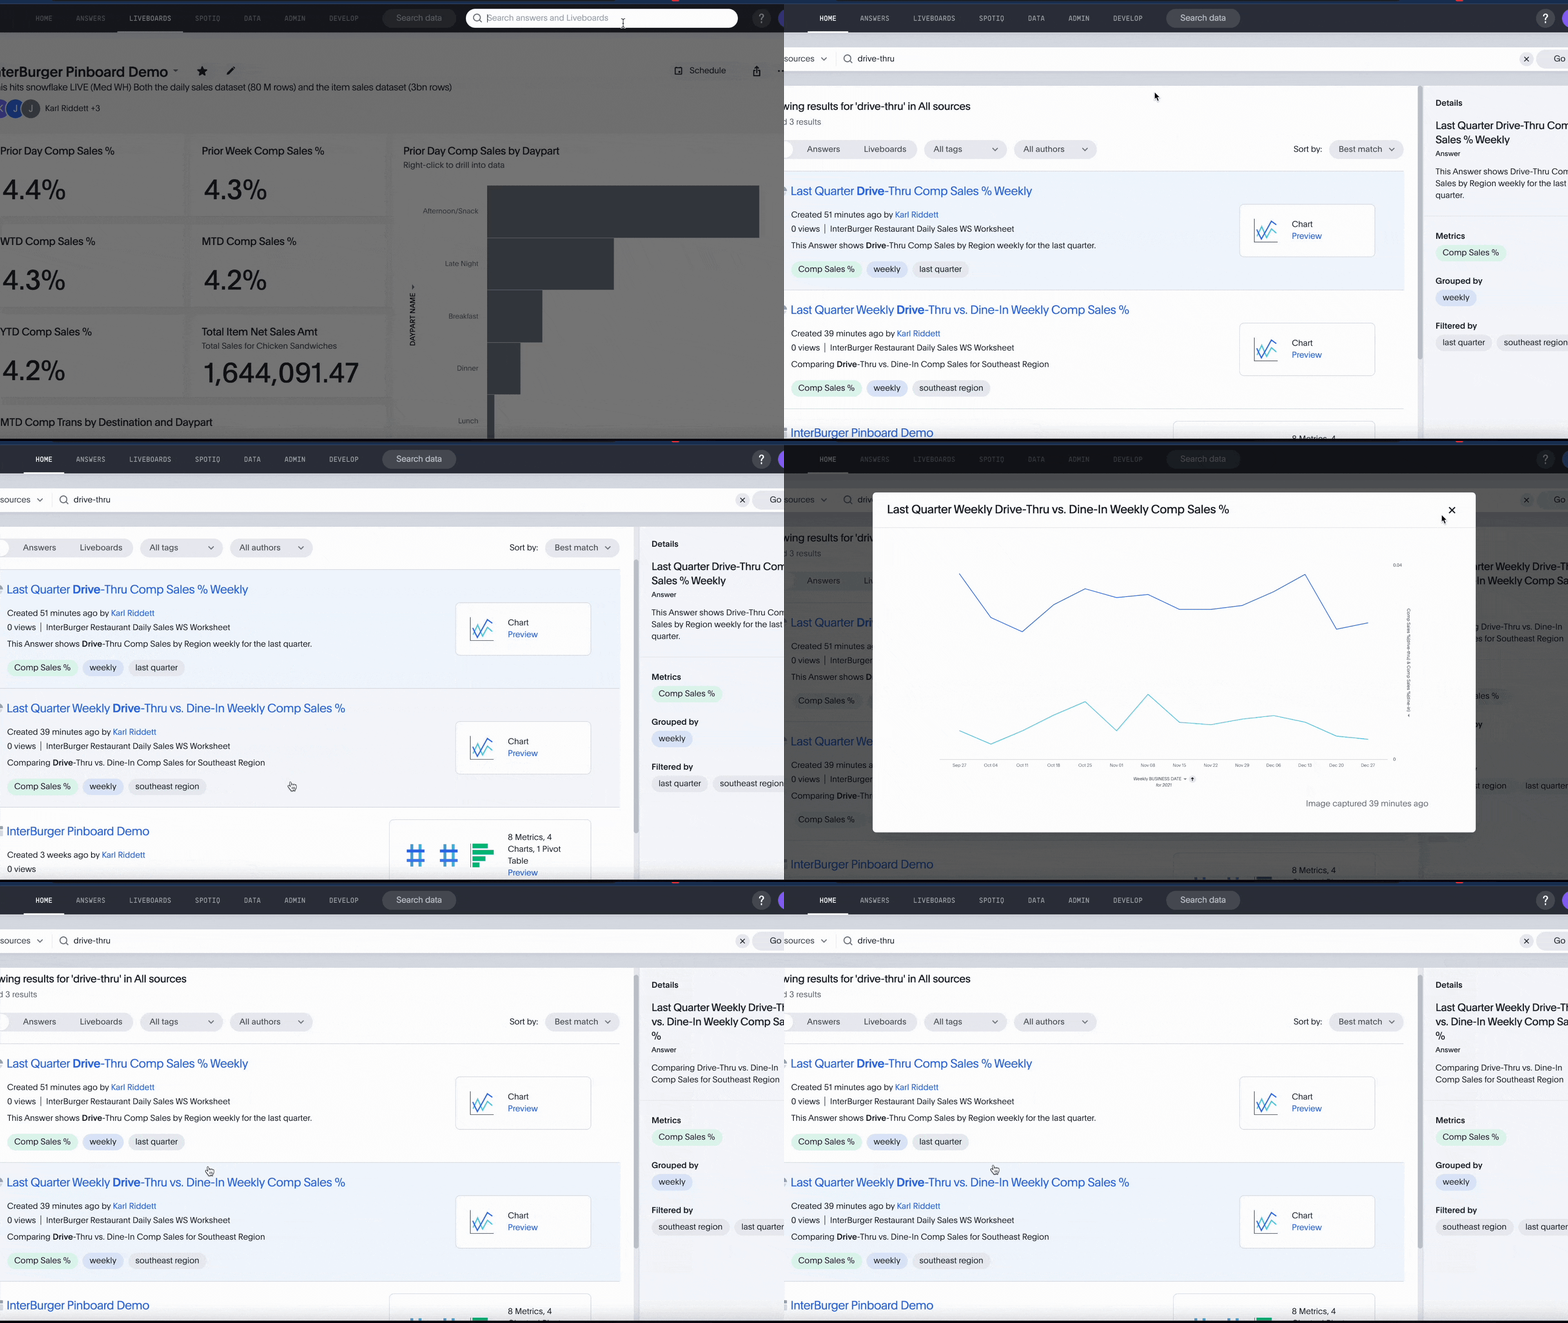
The Power of ThoughtSpot Liveboards
The final layer of visual analytics in the ThoughtSpot platform is liveboards. If you’ve been familiar with ThoughtSpot for a while, you may be more familiar with the term pinboards. Liveboards may look a bit like what you may think of as a dashboard, but they act a little differently (besides having a different terminology).
In many BI platforms, dashboards may or may not be running on LIVE data queries. In many cases, the datasets driving dashboards are proprietary extracts (like in Tableau with their Hyper extract engine). While this usually gives the dashboard a boost in performance, it can also allow data to get stale quickly. With ThoughtSpot Cloud, there are no extracts or built-in data structures. ThoughtSpot liveboards execute all of their queries against live cloud data sources like Snowflake. In our example, we are querying a Snowflake instance using a Medium warehouse.
Some things I really like about ThoughtSpot liveboards that make ThoughtSpot unique:
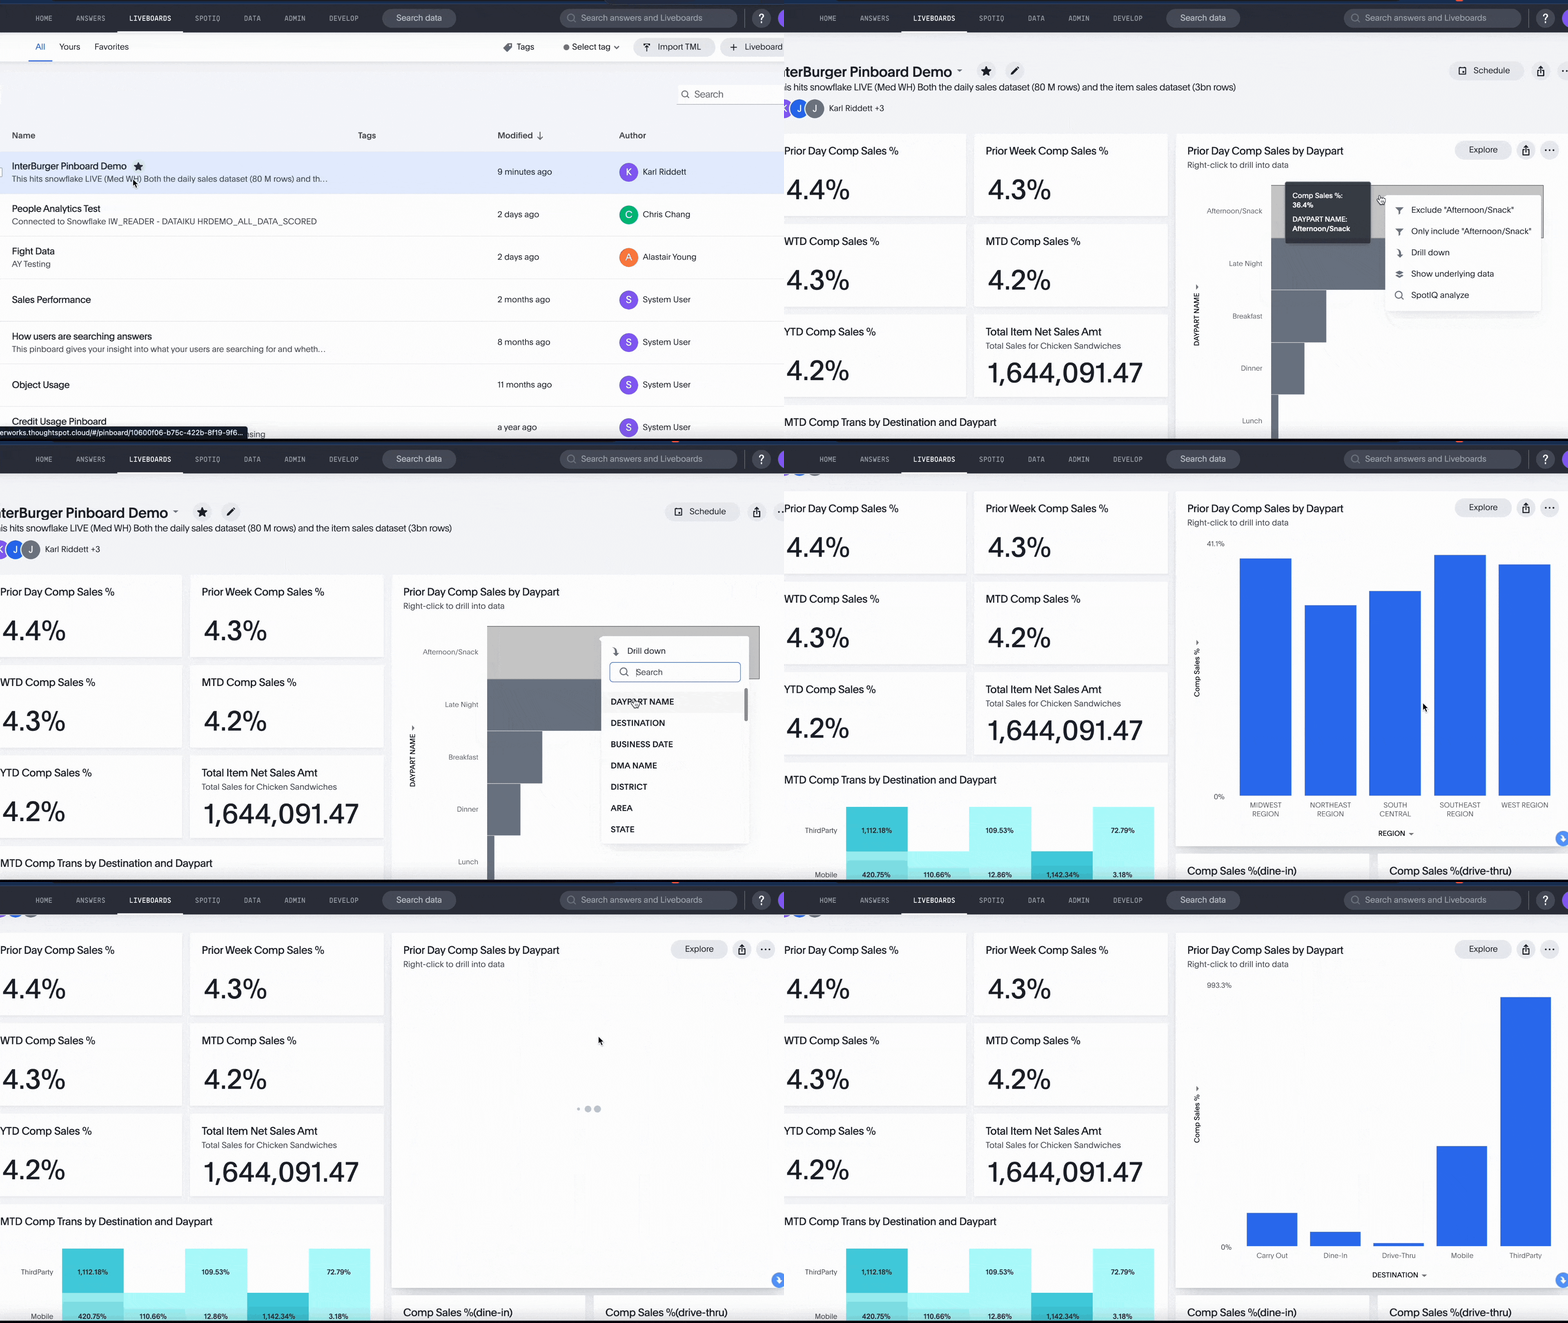
- Drill Into. In many other BI platforms, you have to add the field to your visualization in order to drill down. In some platforms, a hierarchy must be developed in order to drill into a value. In ThoughtSpot, you can drill into any dimension that exists in the data source at hand. In our example, we are drilling into a Region, then a destination when our original view shows just daypart comp sales %:
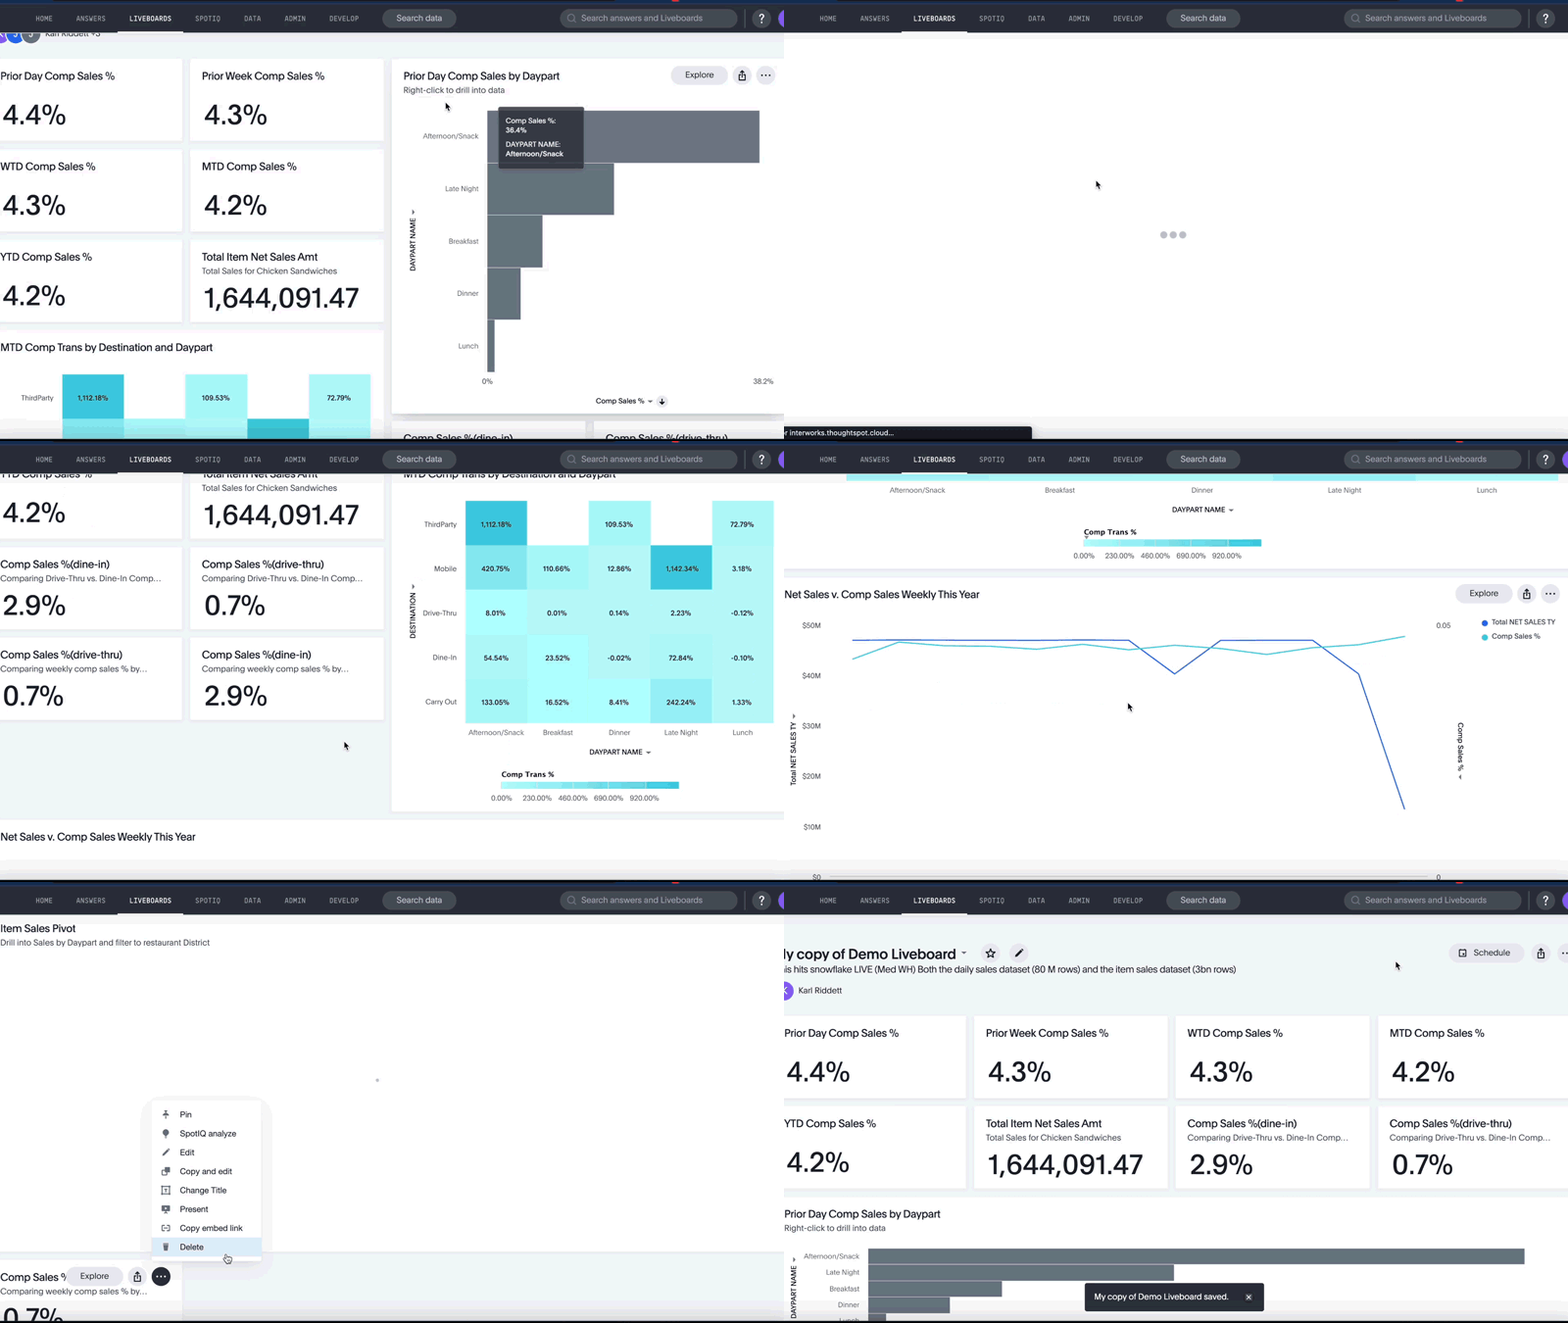
- Customize “My” Liveboard – Copy & Edit. Sometimes, the answer set up by the author doesn’t work well for you. Good news: ThoughtSpot allows you to copy and edit the liveboard and customize it to your needs. Maybe you don’t need that KPI, or maybe you want some views a bit larger than was presented. You can do that here.
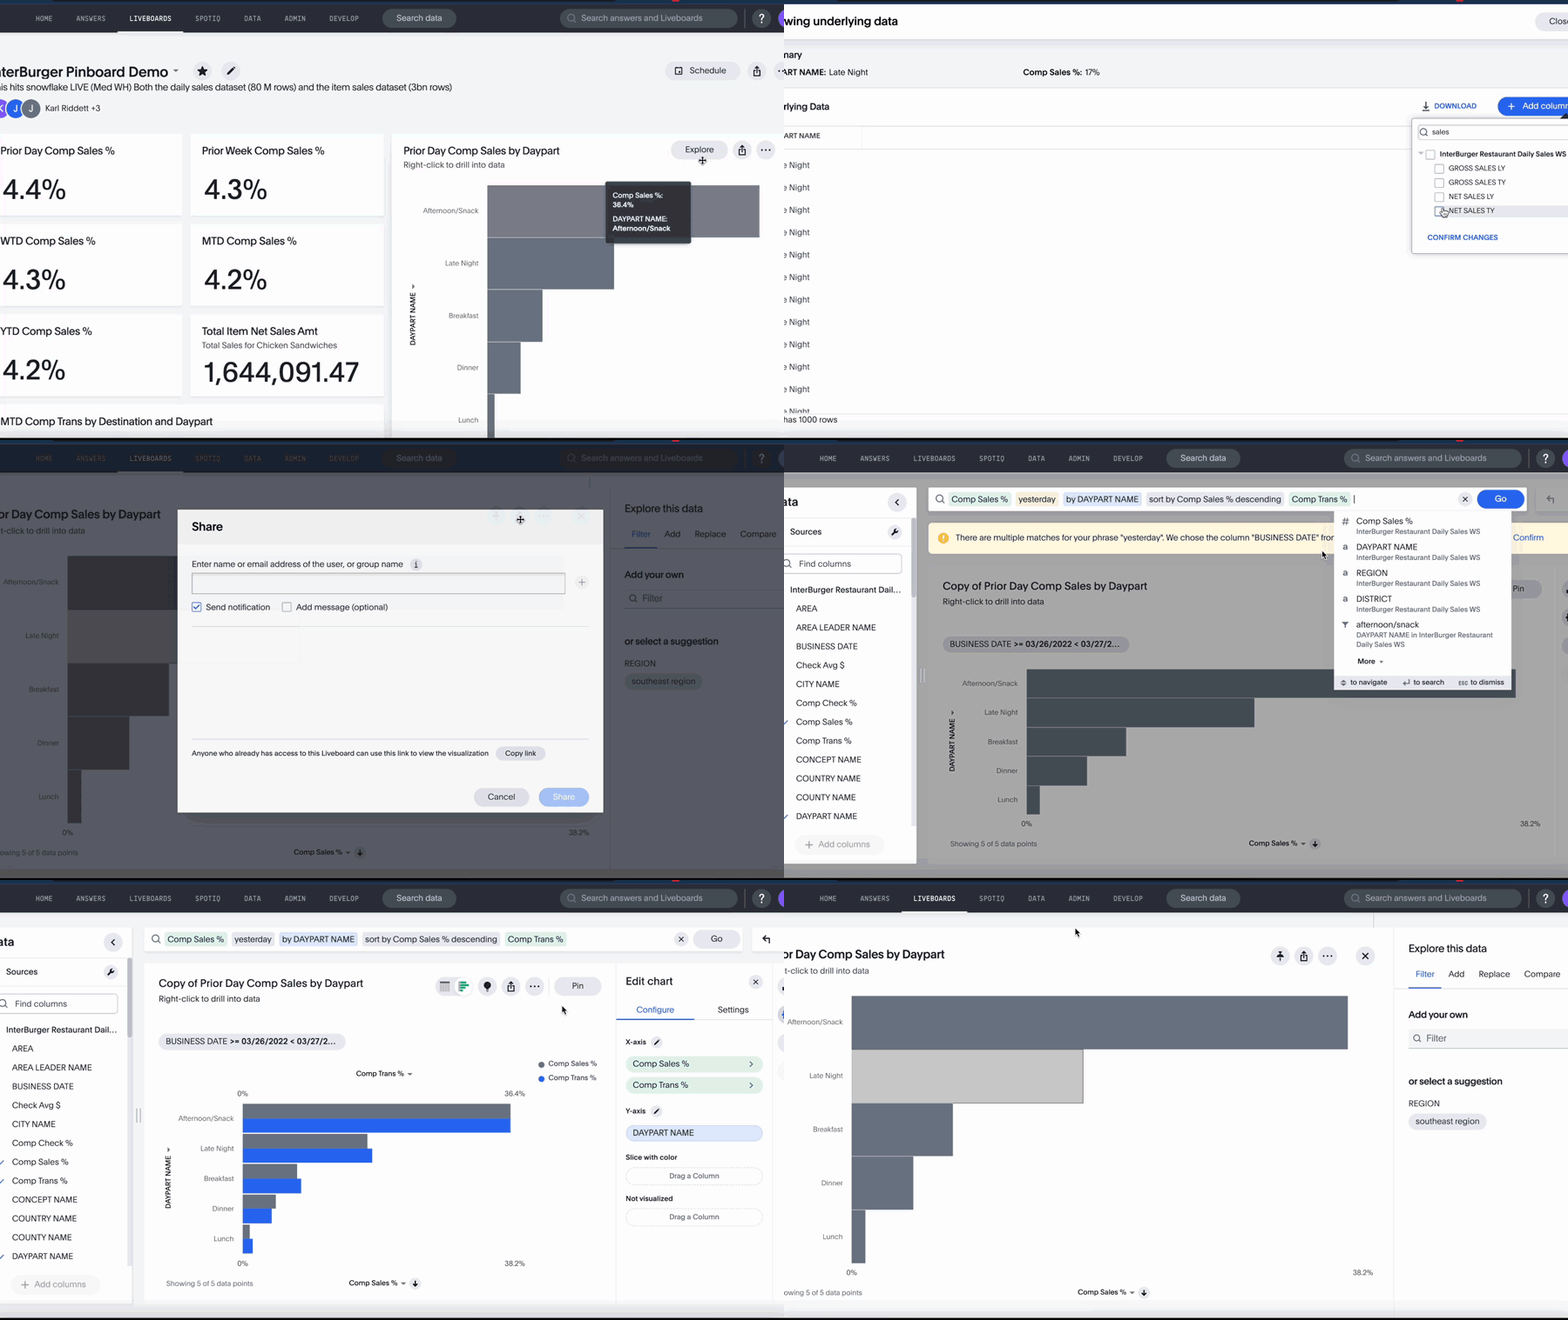
- Explore the Data. Similar to Drill Into, this feature allows a user to explorer a specific answer and ask additional questions not initially presented in the answers:
- Follow/Email. Finally, email is sometimes the best way to get reccurring reminders of data. By following a liveboard, you get the latest version sent to your inbox and the ability to click on that link and go straight to ThoughtSpot.
Some things I wish ThoughtSpot made a bit easier:
- Global filters across the entire liveboards
- Customization of text and visualizations
ThoughtSpot is an excellent self-service, ad hoc, BI platform that is built upon Search. If you have questions about ThoughtSpot, we at InterWorks would love to chat with you further about it. Come back next week for the next post in this series where we’ll look at data and metadata.

