
Behold! An old and rusty feature in Tableau shines in a new light and got a major upgrade!
Tableau version 2022.1 has been released, and with it come a lot of things to make our lives as Tableau developers easier. My colleague Rowan shared an overview of the new features in another post, and we are tackling one of them in depth in this post: the View Data button. It is heavily used by experienced Tableau developers, as well as those at the beginning of their journey, but only if they know about it. And you will after reading this blog!
In this deep dive, we will talk about:
- What is the View Data feature?
- The different looks of View Data in light of 2022.1
- How View Data works in the 2022.1 release
Let’s jump in.
What Is the View Data Feature?
View Data is a feature that hides within all the different buttons in our Tableau Desktop UI, as well as in the hover after clicking a mark in both Tableau Desktop and Tableau Server. Its title is a bit misleading since everything in Tableau is about looking at data, strictly speaking. So, before we discuss the feature, we must tell everyone what we are talking about and where it is:
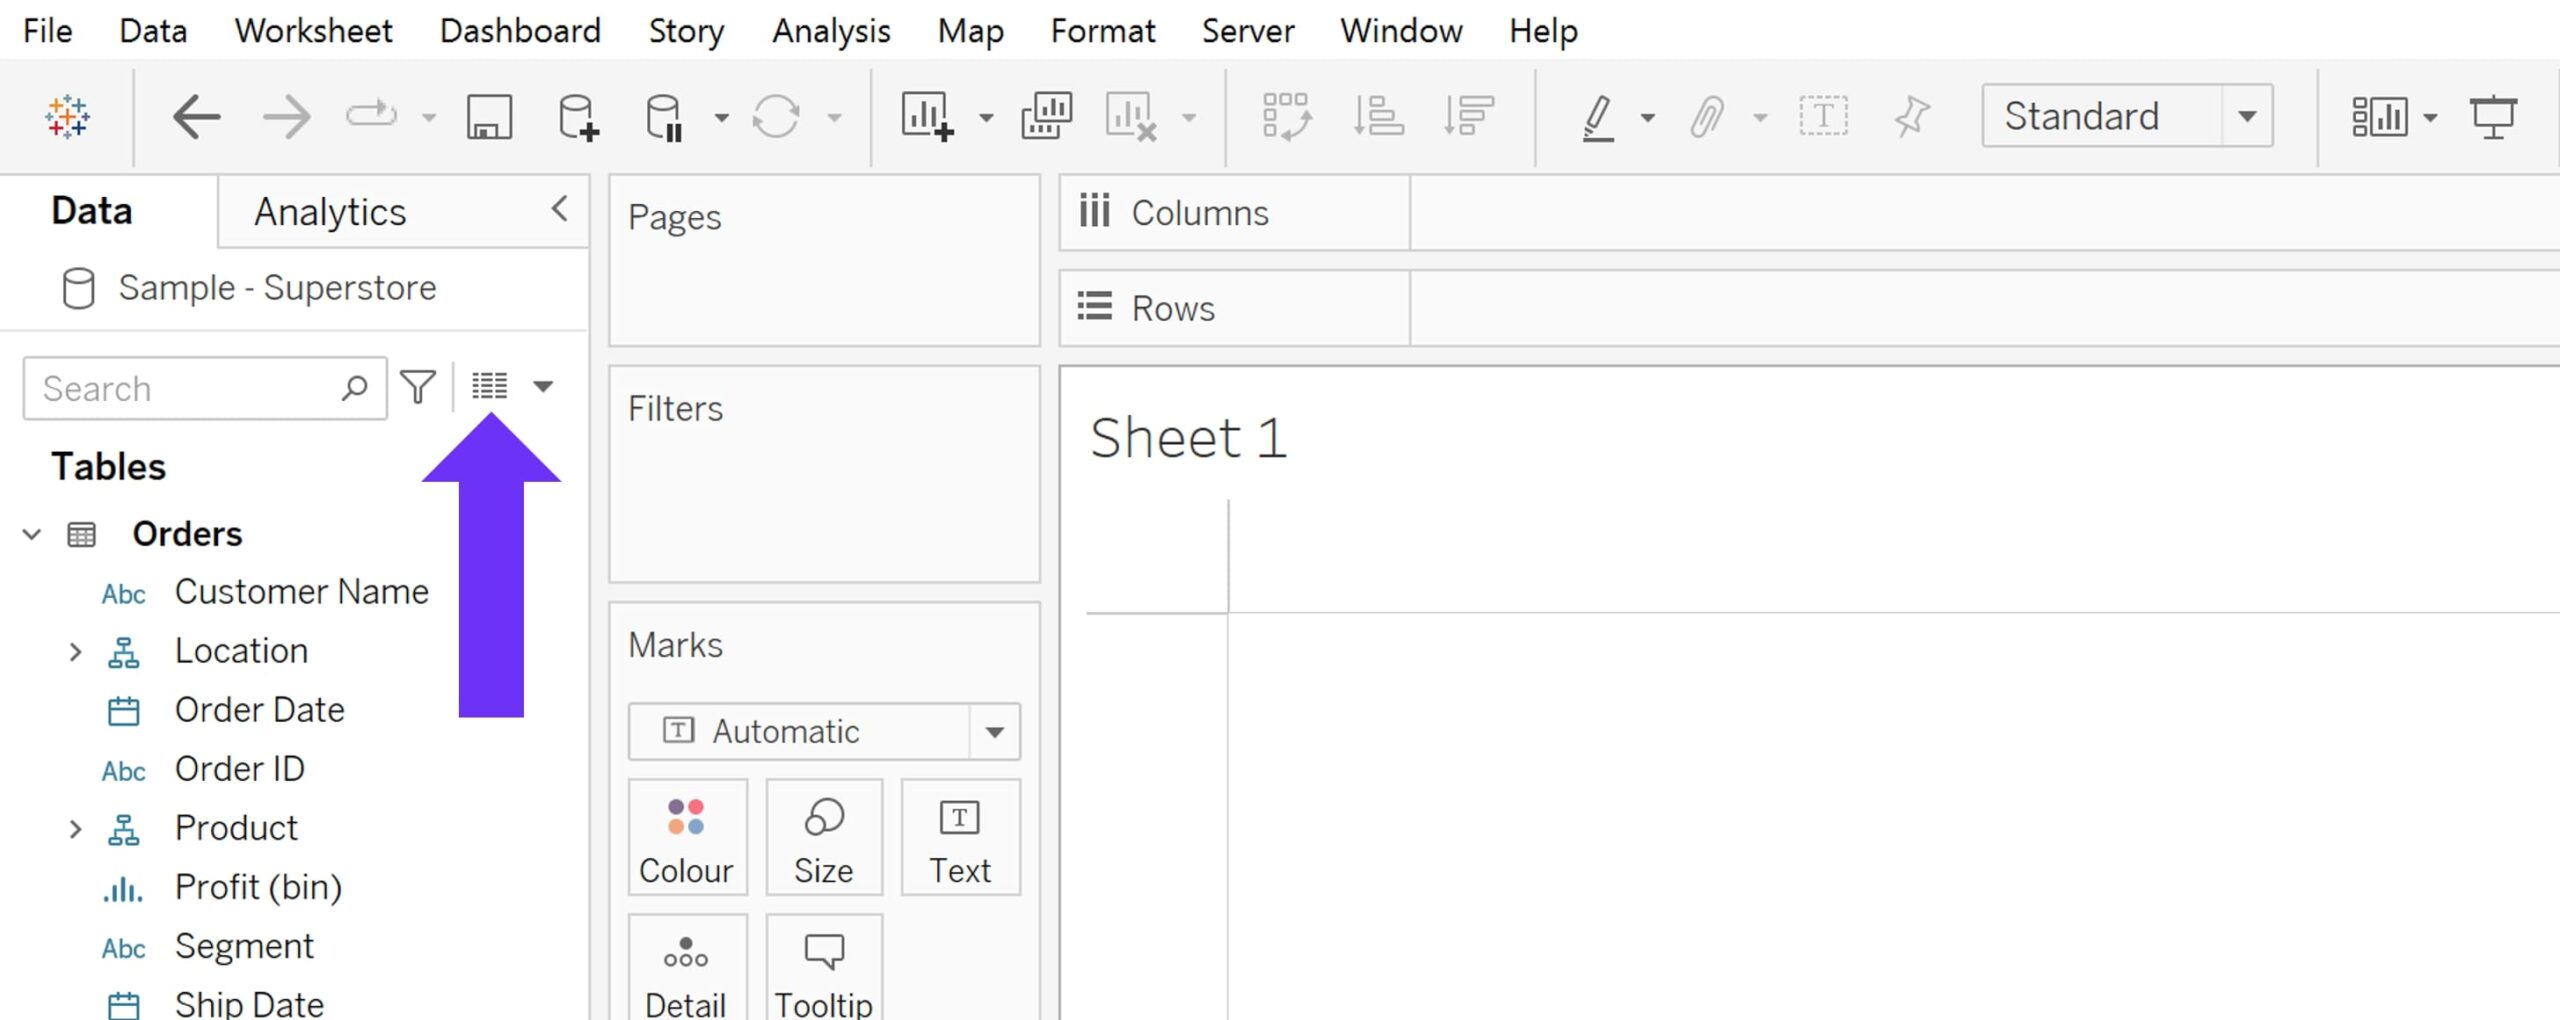
Sitting right next to the search bar and its filter button in the Data pane, it is often overlooked and rarely part of the official Tableau trainings.
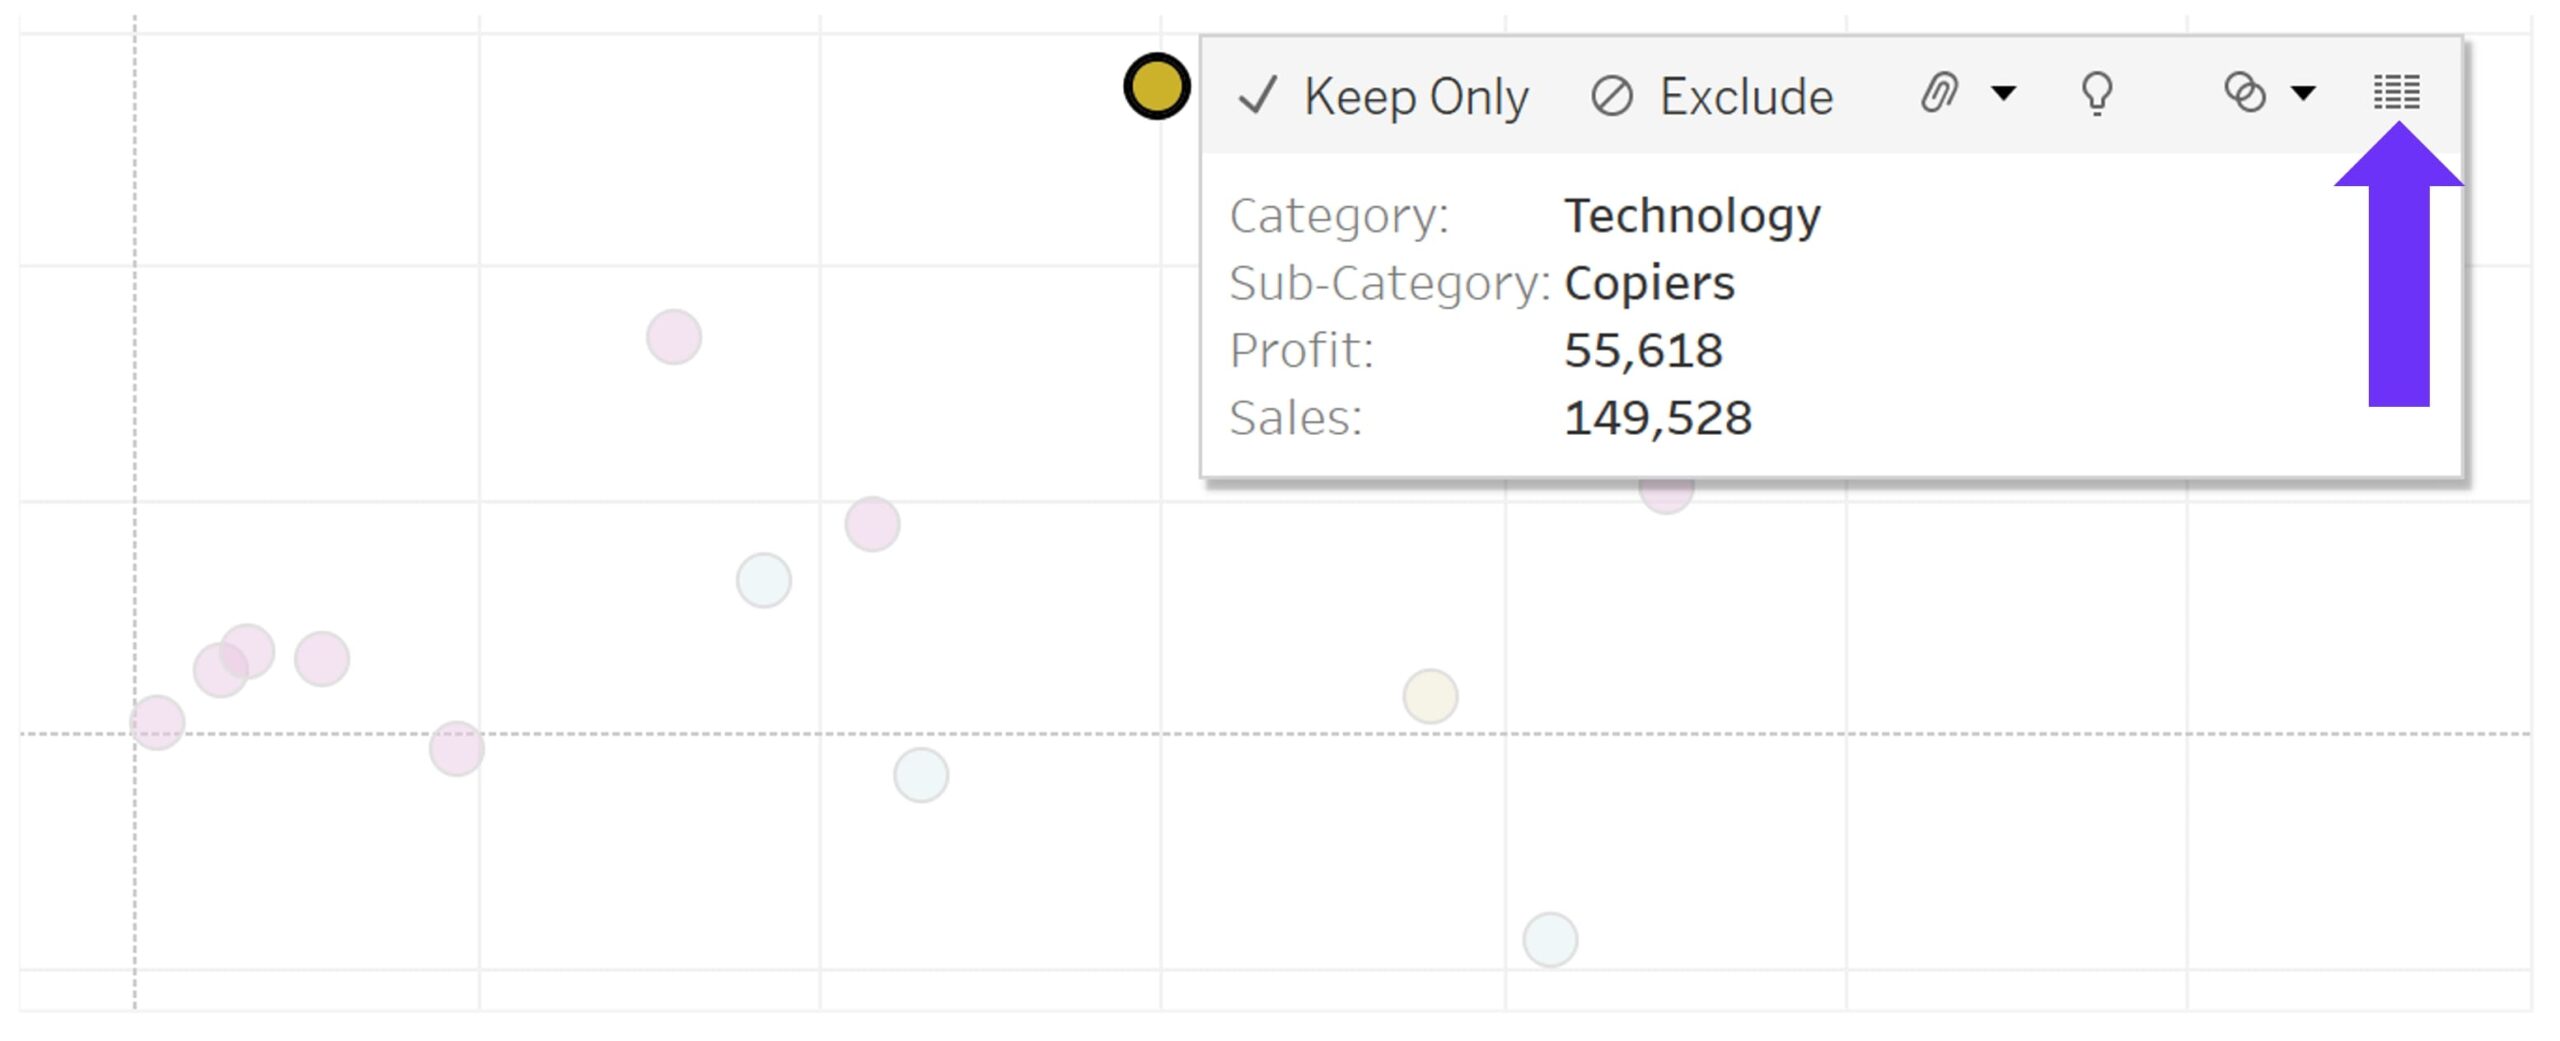
And, as I just mentioned, we also find that button in our actual data points once we click on them:
What Does View Data Do?
View Data shows us the row-level version of the data that we have visualized or are about to visualize in Tableau. It shows a snapshot of the rows of our data source. If we are working with relationships instead of joins (or in other words: on the logical layer instead of the physical layer), all tables of our relationship have their own snapshots. We can also export our data as a CSV file, but more about that later in this post.
Let’s have a look at this feature in the older versions of Tableau, as well as those from 2022.1 onwards:
It shows a snapshot of our row-level data, but to be clear, let’s list out what it doesn’t show:
- Aggregations | As soon as there is an aggregation function in a calculated field—like SUM([Sales])—it will not show.
- Table Calculations | With an aggregation in one (WINDOW_AVG(SUM([Sales])) or a constant in one, table calcs still aggregate.
- Level of Detail calculations (LODs) | Although they work on the row level, they also still perform an aggregation inside.
Why Should You Use View Data?
There are two main reasons for using the View Data feature:
- Get a quick view of what is going on in the background. How does the data we are about to visualize look? What does the content of the actual cells look like? Is the data format fit for the analysis? And especially when we relate a lot of tables with each other: What is this table about again?
- Export or download the visible data, whether it’s:
- a snapshot of our data
- a snapshot of the whole table / all tables
- the data of one or several data points in our visualization
Maybe we are comfortable with Excel and want to do a quick pivot table in Excel. Maybe we are fast with SQL and like to query our data outside of Tableau.
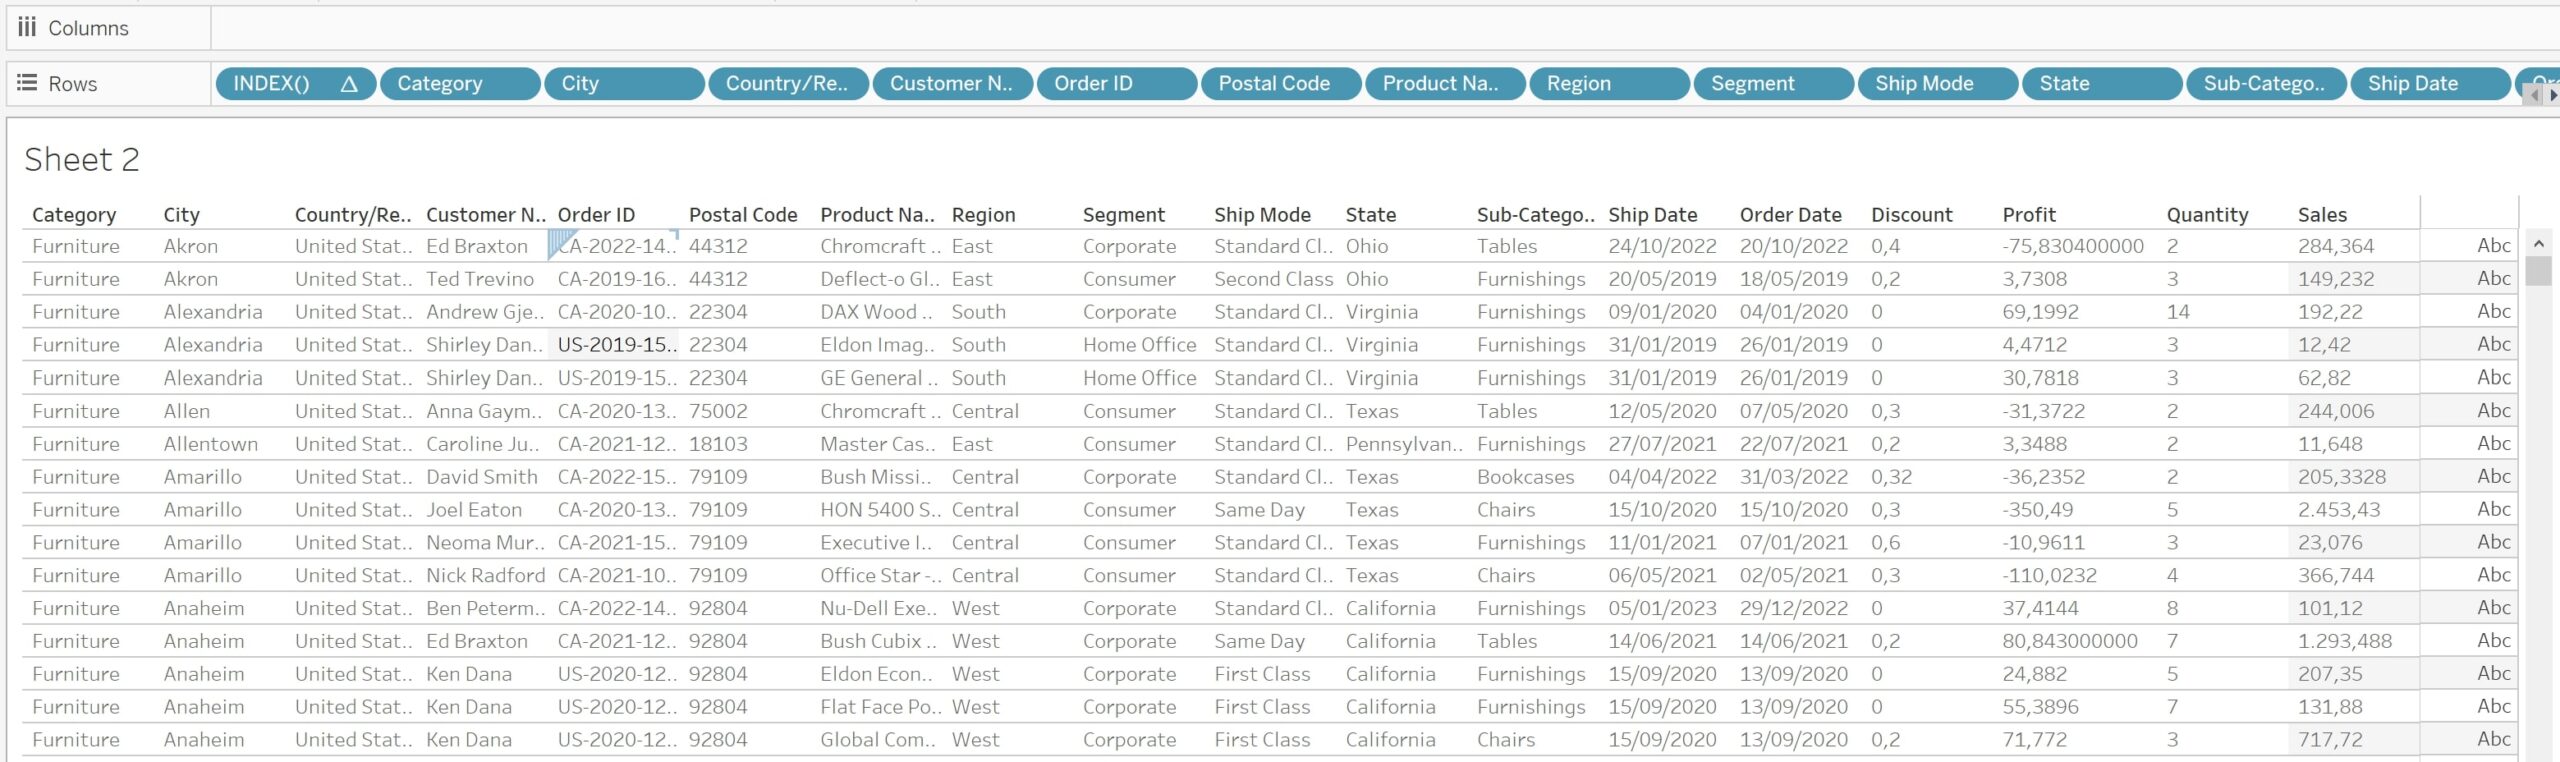
To get a row-level table is kind of difficult to replicate in a sheet where you would usually like to start. We could build this table, of course, with the following steps:
- Click the Pause button.
- Drag all our dimensions onto Rows.
- Convert all date fields (auto-aggregated) into Exact Date and then make them discrete.
- Drag all of our measures onto Rows.
- Make all these measures discrete.
- Optional: Disaggregate the view, just to be sure (Analysis > uncheck Aggregate Measures).
- Add the INDEX() function to Rows, make it discrete, move it before the very first dimension on Rows and then hide its header. Otherwise, we won’t get connected rows.
- Optional: Get rid of the default Abc in the right-most column of the view.
However, depending on the number of fields, this process gets quite tedious. Using the View Data feature saves time and, with the recent changes, even provides additional value.
Now, let’s take a look at the visual appearance of View Data. For people who are working a lot in the Data Source tab, it will seem that Tableau has migrated the design of the Data Preview into the View Data feature. Let’s investigate.
Optics
The look is now the same one as in the Data Source tab. The thin lines for our rows that looked quite static have been replaced by higher rows, making the content of the cells far easier to read. The fonts are not black anymore but grey, adding even more readability points.
We now got real field headers as well. Before, the headers had the same text format as the cell content, and the only thing that made them stand out was that they were on top of the columns. The field headers are now black, bold and bigger than the cell content.
On top of each field header, we find the field’s data type, like in the Data Source tab. This icon is purely to show the data type. Unlike in the Data Source tab, we cannot change it here. And that makes sense since the View Data feature is basically only a snapshot of our data.
Rearrangements
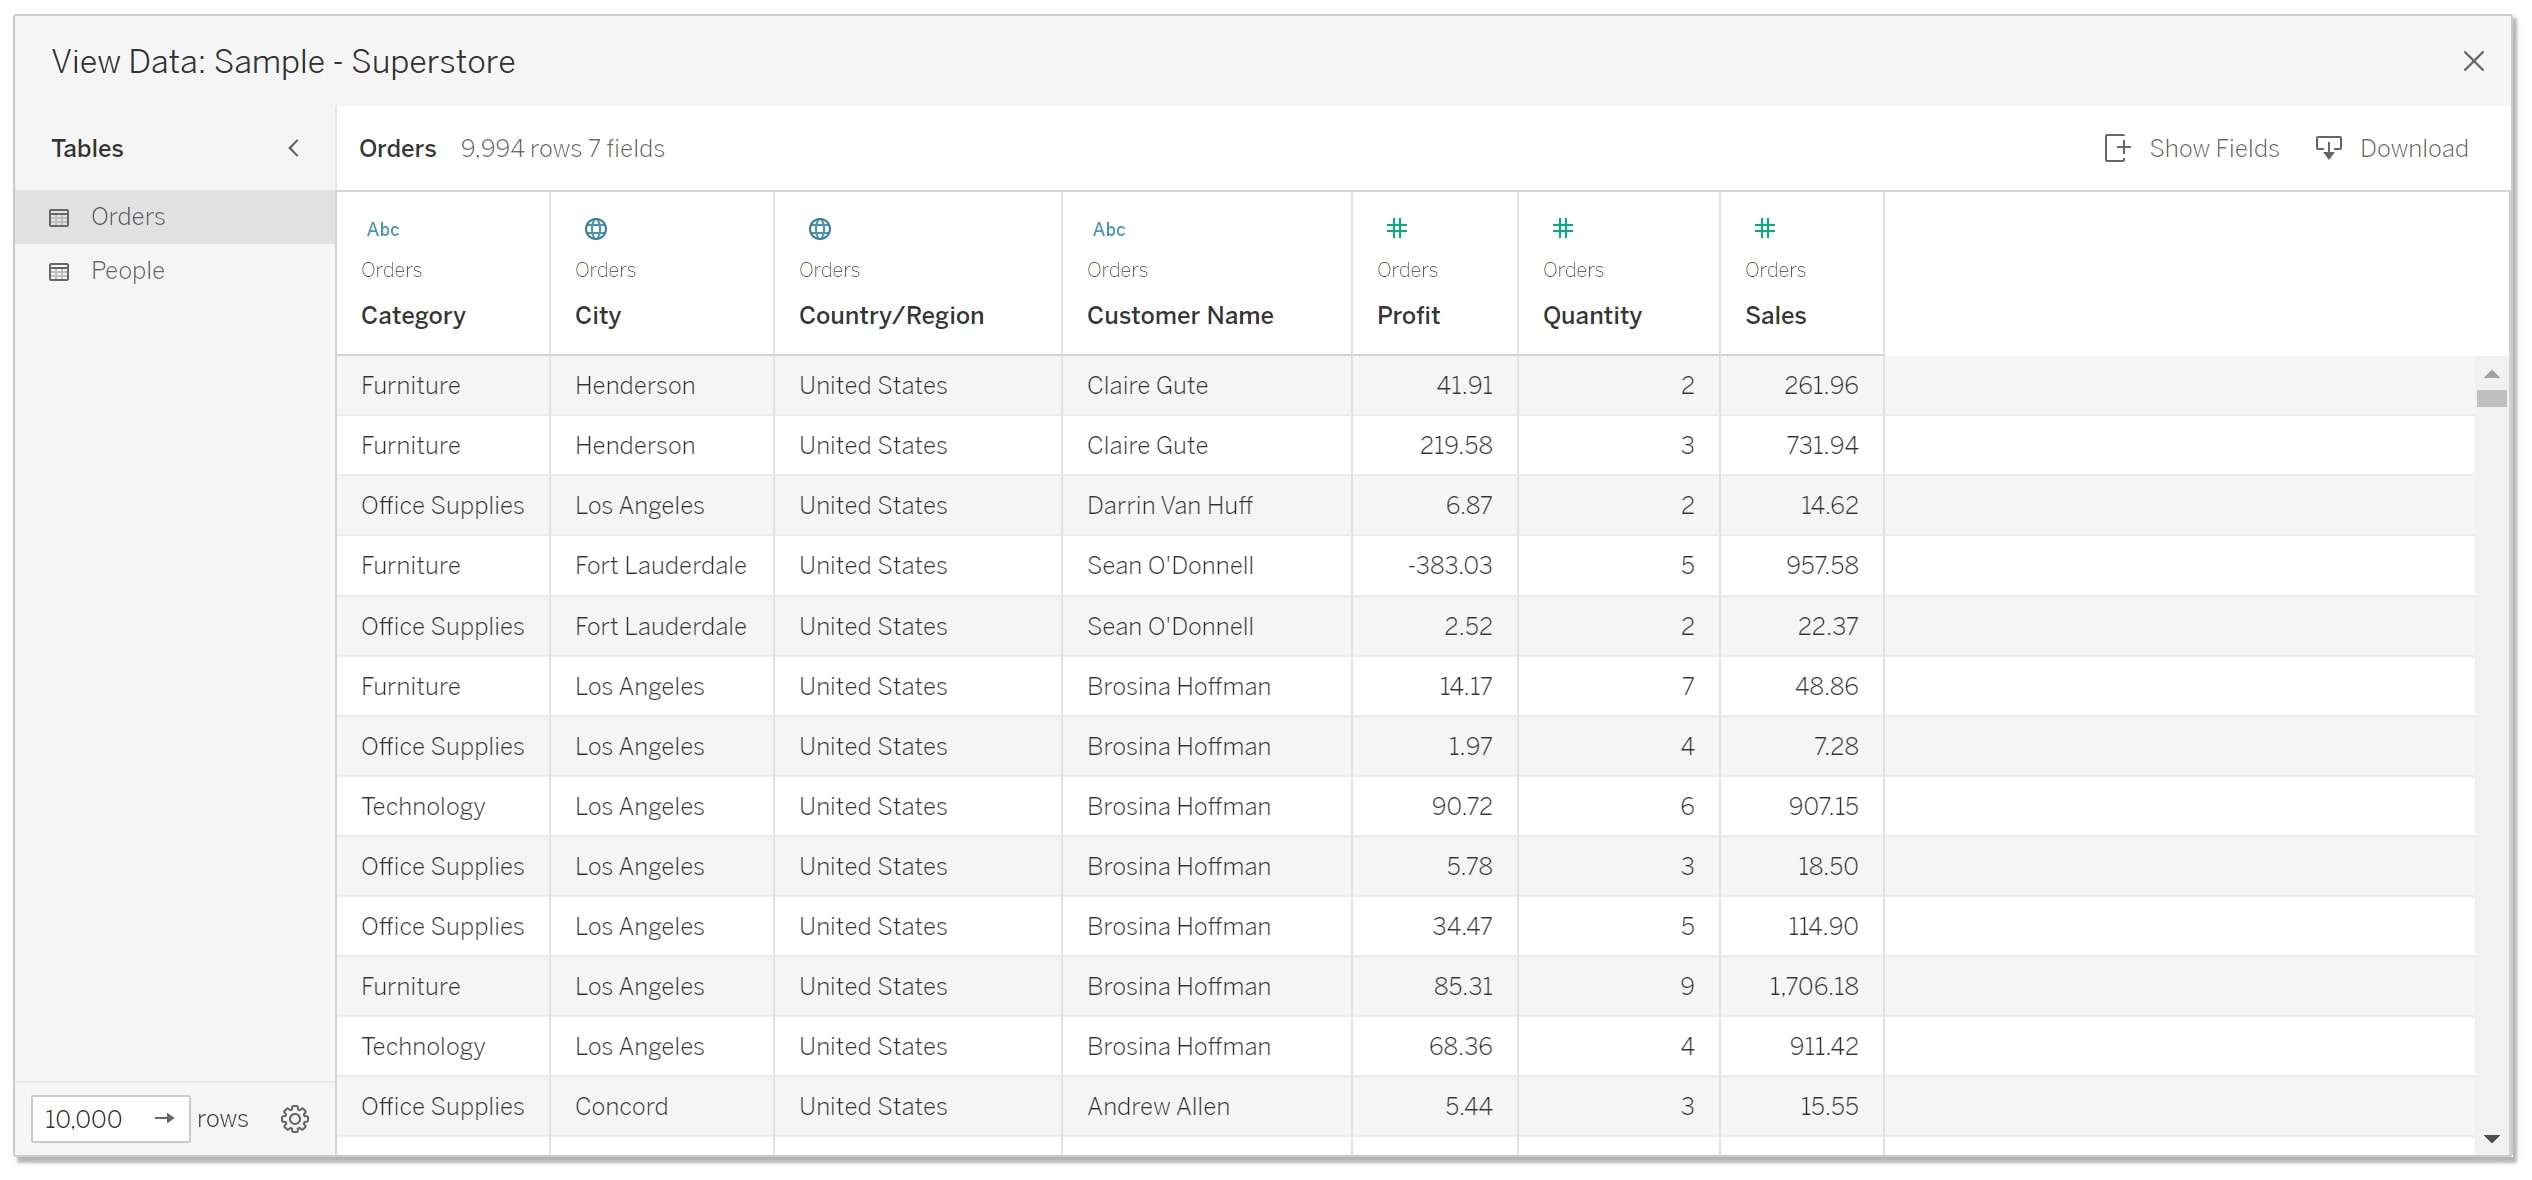
The table names have moved from the bottom to their own area on the left, where they are listed vertically. As before, we can click them to switch between the row-level data of our tables.
Also, we now find the row count in this area, with which we can decide how many rows are maximally shown as a data snapshot, and a Settings button, that—right now—only has the option to show hidden fields. This whole area is collapsible to make some room for the data on the right.
The current row count has been added at the top. This is important because the maximum row count, set in the area on the left, might actually be higher than the actual count of rows (Maximum set to 10,000, but the table has only 9,994 rows). Next to that number, we also get the number of field, that are shown. This becomes quite handy when we deal with a lot of fields in there that don’t fit into the window at once.
In the upper right, we find the download button (previously named Export) and next to it a new Show Fields button that we’ll talk about in a bit. Also, the Copy button has been removed, which we could use to copy a single field into the clipboard. There is a better alternative now.
Ideal Use Cases for View Data
We know View Data is primarily used for getting a quick overview of what’s going on in the background with our data and for exporting or downloading visible data. Maybe we want to analyze the data with Excel and build a pivot table there. Maybe we want to export the data as a new data source to analyze it in SQL or again in Tableau. Maybe we need to build a simple report consisting only of row-level data. There are a lot of scenarios, so let’s get started.
With View Data, getting an overview of the data or reminding ourselves of it became a lot easier to manage. We have a great overview of our fields, can see their values without having to pinch our eyes, can see their data types, and the right header titles are easy to find. Also, we don’t have to sniper for the different tables; they are easily clickable in the area on the left:
The exporting reason was given a full upgrade in terms of functionality. When we want to download the data, we can still do this. Just click on the previous Export button, which is now the Download button. The outcome is a CSV file with a comma as the delimiter.
But now, we can shape the data that we see and download. We are given all the flexibility of building this row-level view on a sheet ourselves, but with only a few clicks. Here are the changes:
- Sort the fields by the right-click menu instead of left-click. There were so many accidental sortings of fields before simply because we selected a field. Up to version 2021.4, every left-click on a field header sorted that field whether we wanted to or not. That’s history now.
- Show and remove fields from View Data. This is a great addition. We are now able to switch fields on and off with this new button in the upper right, and through this we’re able to choose specific fields we want to see or export. And only the fields selected will be downloaded later on! If we did this in a tediously built table in the view itself, we would need to hit the undo button all the time to get fields back into the table. In the View Data window, it’s just ticking and unticking fields.
- Re-ordering the fields is not drag and drop anymore. Instead, we get three new ways to do that:
- Use the arrows on top that appear when selecting a field.
- Go via the right-click menu.
- Remove and show fields. If you remove all fields then add them in again, they are ordered in the same order you click on their Show button.
More Ease of Use with View Data
A reminder: Whatever you do here, whether sorting fields, re-ordering them or removing them, it will not affect your visualization or Data pane, so play around as much as you like. You cannot break anything.
This means that if we want to download our data in a specific order of its fields, or if we only want some key fields that are important to us, we can do that now without walking a tedious and complicated path and building a table in a sheet.
All in all, there is ample opportunity for your data as a result of the 2022.1 release. This is a great advancement of this underrated and often underused feature!