
It is a great time of the year. The sun stays out longer, the weather starts to warm up, and the 2022 PGA Tour season is in full swing.
Netflix recently announced they are working on an all-access docuseries following the PGA Tour’s best. The show will give exclusive access to some of the world’s best players on the PGA Tour as they travel and compete in the biggest events. As an Oklahoma State University grad, I am most excited to follow fellow cowboys Viktor Hovland and Rickie Fowler.
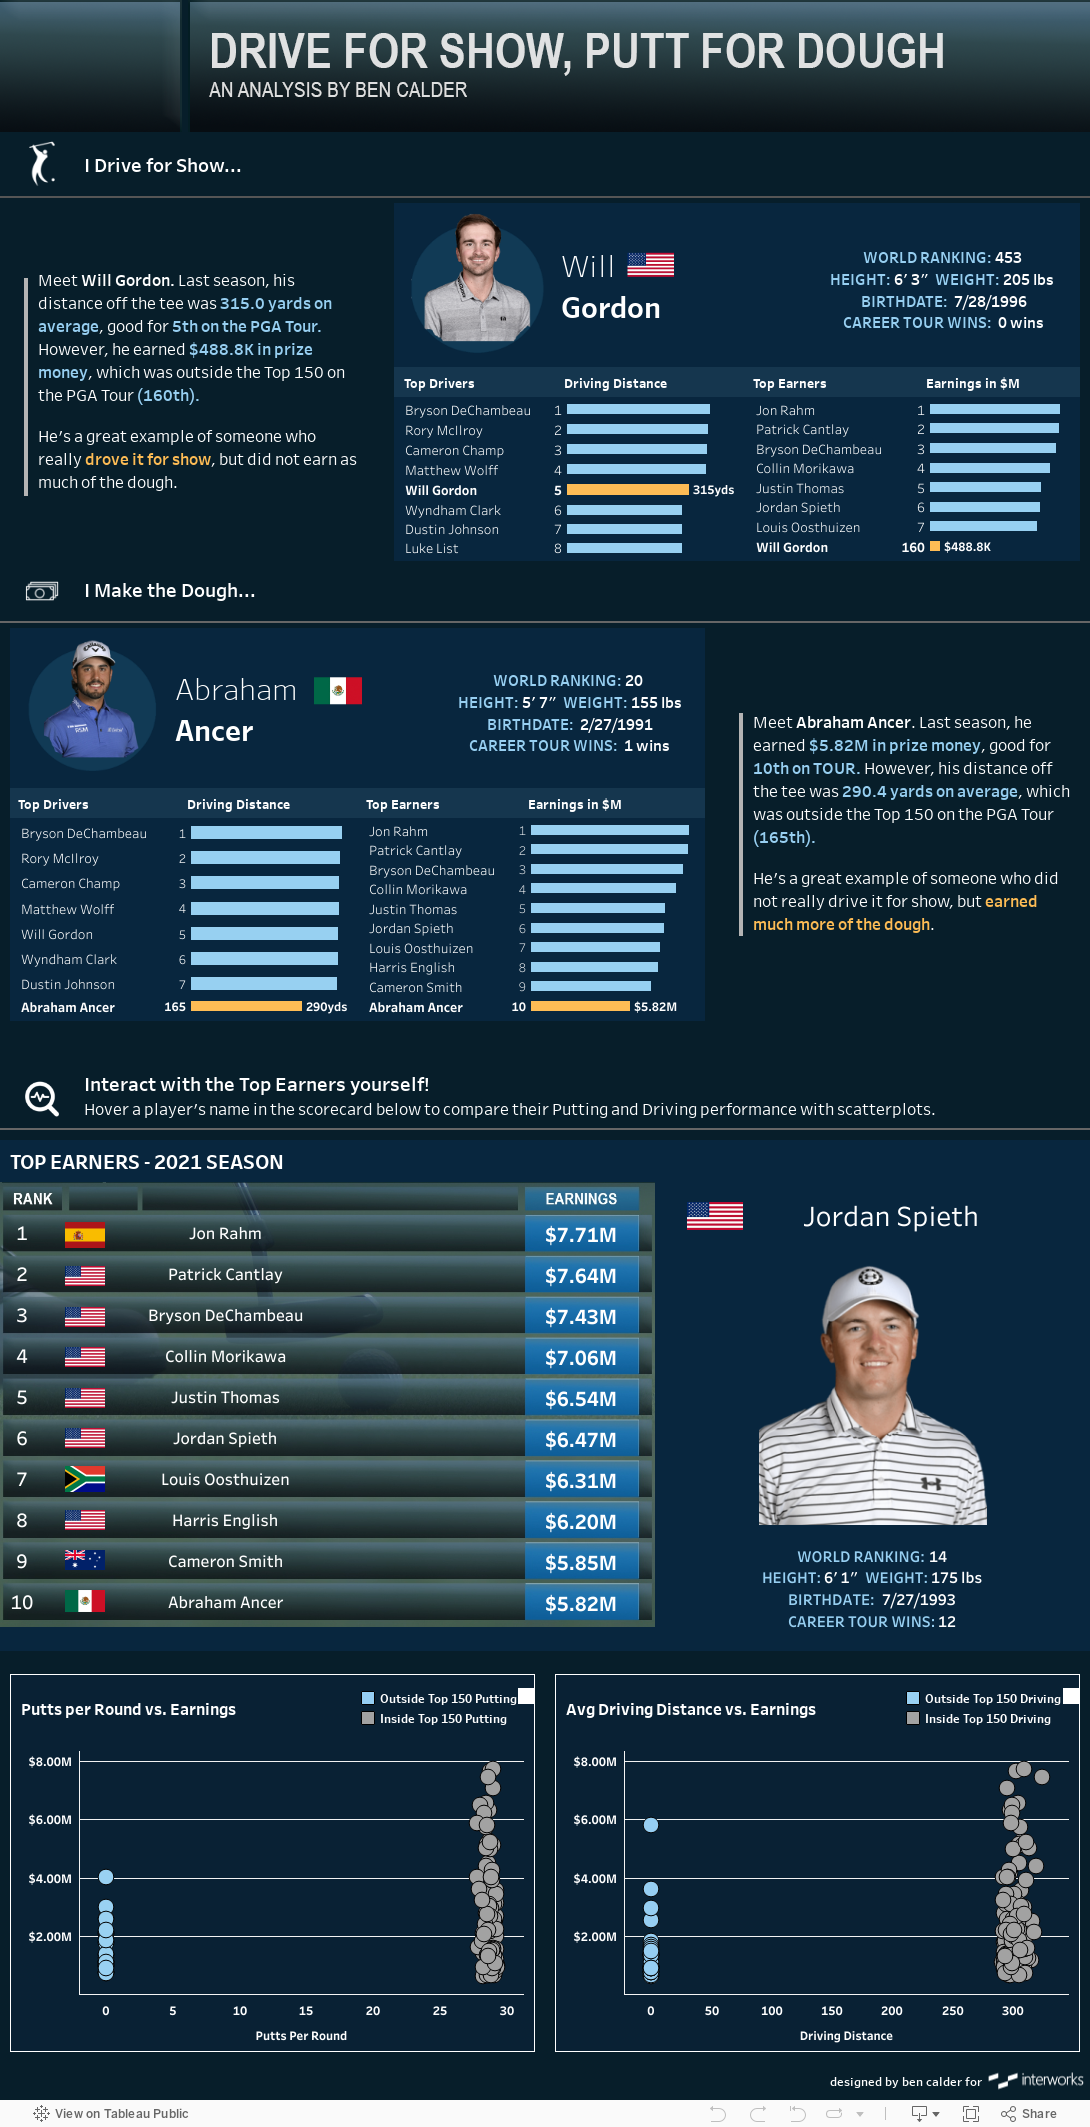
In response to the announcement, I decided this was a great opportunity to embark on a side project coupling my passions of golf and data. When it came to topics to viz on, I couldn’t help but ponder one of the more popular adages in the golf world: “Drive for show, putt for dough.”
In basic language, you can translate this as: “The people who drive it the longest might look cool doing it (the ‘show’ component), but the best putters end up making the most money (the ‘dough’ component).”
Drive for Show, Putt for Dough
This begs the question—do the longest drivers of the ball earn the most prize money, or do the best putters? There are plenty of statistics out there for analysis. However, to best analyze our statement of “Drive for show, putt for dough”, I intentionally chose the following categories (from the 2021 PGA Tour season):
- Top 150 Money List – which players earned the most money?
- Top 150 Avg. Putts per Round – which players hit the fewest putts on average per round, i.e. who is holing the most putts?
- Top 150 Avg. Driving Distance – which players hit the longest drives?
Our question is this: Is there any correlation between these categories and prize money? Fortunately, I did the heavy lifting and attached a viz that lays out some findings:
Other than wanting to improve my game off the tee and around the greens, I am super excited to follow the PGA Tour this season and cannot wait for the docuseries to air. According to Golf Monthly, filming is underway with the first episode expected to air sometime in early 2023.
Make sure to keep an eye on new blog content as we are adamant about keeping you and your organization up-to-date in all things analytics and data. And if you want to explore this viz further, check out the attached workbook at the bottom of this post.