
We love working in Tableau, so it was a great privilege to support them when they approached us and asked, “Write down everything you know.” The outline of the idea was to take a previously written whitepaper from Alan Eldridge and update it to support all of the platform’s subsequent updates. This meant 15,000 tests and 330 hours distilled down and documented, which we did in 82 pages. You can download the whitepaper Best Practices for Designing Efficient Workbooks here.
Our process in short was: create test, run test, re-visit test and write, write, write. If haven’t got time for 82 pages, we hit the highlights in this webinar. If you need this content even further condensed, jump to the bottom of this post for some high-level takeaways.
Bringing Efficiency to Tableau Dashboards
Let’s start talking about designing efficient Tableau dashboards. What we mean by efficient is dashboards that are pleasant for the end user, load fast and respond to queries quickly. Here, we’ll be covering what performance means and our typical approach to creating high-performing, efficient dashboards.
The central idea behind this is a quote from Peter Drucker, a management consultant, educator and author: “Efficiency is doing better what is already being done.”
So, why is performance important? Load times are one of the first aspects of our dashboards that is visible to users. If load times are too long, we could lose our audience before they have even begun to experience our dashboards. If our goal is to deliver answers to an audience and capture and keep their attention, we can address most of these performance problems with architectural changes around the design of the dashboard or the data sources.
We hate to disappoint you at the outset, but there is no magic bullet when it comes to performance optimization. It’s typically an effort over time to make incremental changes and improvements, and those have a cumulative effect rather than a switch you can flip.
Some Important Notes:
- If you are already seeing slow load times of your data going into Tableau, it will continue in the Tableau workbook. As magical as Tableau is, it won’t be able to resolve this issue.
- From the Tableau Server perspective, a key finding for us as we were updating the whitepaper is that Tableau has added a substantial number of improvements in recent versions—so much so that if you are on an older version of Tableau, it is definitely worth upgrading your environment.
Streamline Data Sources
Having an optimized experience for the end user is determined by the processes further upstream. Below are some areas to explore right from the start to ensure you’re setting yourself and your workbooks up for streamlined success:
- Extract – The use of extracts or hyper-files over live data sources will give you improved performance; extracts were designed for read-optimized analysis. There is something to be said for them being local to the analytic platform, meaning that it’s hard to beat a read-optimized data store that is part of your analytics system. We’re not saying that you shouldn’t use live data sources, but for your mission-critical dashboards, using extracts is one of the first steps to optimization.
- Filtered – When you can, you’ll want to make sure you are applying reasonable/rational filters to the entirety of your dataset, so you’re not bringing in large amounts of data that are completely irrelevant to your analytics.
- Aggregated – Again, this depends on the purpose of the dashboard, but if you’re doing exploratory/detailed analysis that needs to focus on drill-ins and have lots of details on demand, that’s a reason to have un-aggregated detail as part of the extract. If not, the large number of records that Tableau has to aggregate will play a big factor in load time.
- Extracted Calculated Fields – Within the data source itself, if you’re using extracts, you can materialize calculated fields so that they are permanently part of the extract rather than being calculated on the fly.
Smooth out Data Connections
- Well-Defined Joins – One of the new features Tableau has added that makes a huge impact on our approach to performance is the new relationship model. You want to factor that in and use it when it makes sense. It’s worth thinking about how you’re joining different tables and data assets together. Depending on whether you’re doing it by a join or a blend, be sure you use the relationship model where you can; it tends to be faster and gives Tableau more flexibility in optimizing the data.
- Data Source Filters – Limit the universe of the data you’re bringing in, when possible, and set filters at the data source level.
- Filtered Extracts – Set those filters at the extract level.
- Hide Unused Fields – Whenever you’re creating an extract, you’ll want to take your unused fields – the ones you’re not using in your analysis or that you know you’ll never use – and hide those, so they are not part of the extract. It’s more of an optimization for the extract refresh time than it is for the loading.
Optimize Tableau Server
Adequate Server Resources – We will just point out that you can optimize all of these other areas, but if your server itself doesn’t have adequate resources, you’re still going to see performance issues. There are several tools available in the community for evaluating load on the server. If you are seeing good load times locally but are degradation when you push up to Server environment, it might be worth speaking to your Server administrator to see if there is contention happening.
Optimize Tableau Workbooks
There is no objective load time that we would apply to all dashboards; it is, however, the expectation of the user in how we measure performance. It’s useful to talk to your users to understand what their expectation of an acceptable load time is.
Let’s talk about what you can do in the workbook to optimize its performance:
Calculated Fields – Typically when people are creating dashboards, they are prototyping business logic that doesn’t really exist in their databases. Often, they are putting these calculated fields into Tableau and experimenting with them. What that typically means is when you’re putting those calculated fields into Tableau, you are forcing Tableau to calculate and render that logic on the fly or at run time while your users are sitting there waiting. For optimization, we materialize these calculated fields in the extract (where we can) or back into the database. Consider if there is a DBA to do it and whether or not the effort is worth the reward.
Ask Yourself These Questions:
- Can you avoid custom SQL by doing what you can in the data source?
- When you are pushing data back into the database, can you pre-aggregate?
NOTE: Level of detail (LOD) calculations follow the same logic as row-level calculations in Tableau.
Another consideration for optimization is if whether we can use a native feature in Tableau instead of a calculated field. Splits and hierarchies should be a replacement for most common calculated fields. In our testing, we were surprised to see that one area where this goes against intuitive logic is groups. When we think of grouping, we tend to think of four different methods: groups, sets, Tableau’s native Group function, or IF/ELSE/THEN statements. Out of those four, the order of preference from an optimization perspective is as follows:
- CASE Statements
- Sets
- Native Groups
- Nested Statements: IF/ELSE/THEN
The reason that CASE statements perform better is that that they can be evaluated in the order that you define them. Beyond that, the relationship feature (v2020.2) is a more flexible alternative to the existing join structure or blending you might be doing.
Additional Quick Tips for Calculated Fields:
- MIN and MAX are faster than AVG and ATTR
- Use IN instead of OR
- Be careful with nested calculations
- Avoid Count Distinct
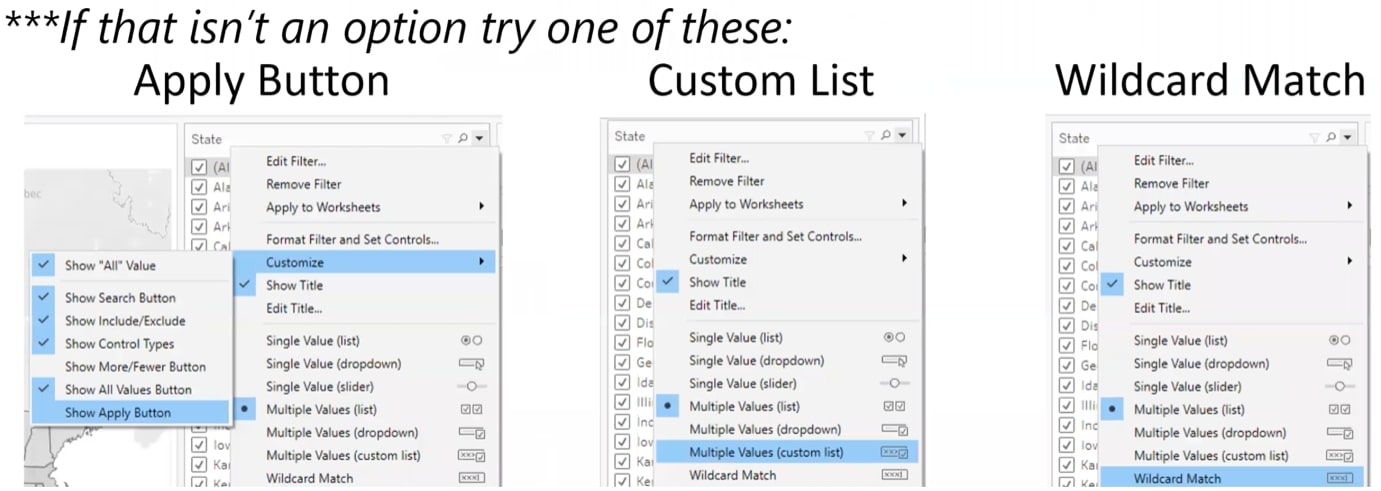
Streamline Filters for Performance
When possible, set your extract filters at the data level to limit your data to what you need for your analysis. This will limit the size of your data that is coming in. When you can’t use those, make sure you are defining your filters at the data-source level instead of the extract level. Finally, looking at the context filters in the workbook itself, Tableau has optimized their performance substantially. You won’t gain anything from using them, but now you won’t lose anything from using them. Use them whenever functionality dictates.
With filters, you will want to be wary of putting of your level of detail in the dashboard all at once because it forces Tableau to render them simultaneously even though your user won’t be using them all at the same time. We often recommend taking your dashboard and creating a user experience that is a lot like using a funnel – start with a high level of detail and then drill down.
Lastly, you want to beware of using relevant value filters. They can generate additional data query loads out to your data source. We aren’t saying don’t use them; just use them when they make sense.
Cardinality Tips for Efficiency
At the data-source level, cardinality refers to the grain of the source and what one record actually references. In the workbook, what we are talking about is the level of detail required to support your filter choices. That number of items does make a difference for load time. An alternative option is to reduce the number of items in quick filters or follow the steps outlined below:
Or, if you’re not using filters and instead you are using parameters, you can use a CONTAINS() function there and combine that with a calculated field.
Last of all, when we are talking about cardinality, we see people using blending for many too many relationships. It’s worth pointing out that if you are doing that now, the Data Relationships in 2020.2 is going to be worth evaluating or moving to if at all possible.
NOTE: You only need to define the relationship on the lowest-level granular field rather than define the relationship for every data field common on the data source. Otherwise, what you will find is that for every defined relationship field, the query time increases on the backend.
Build Dashboards for Optimized Performance
The first high impact you can have is to reduce the number of marks that are being rendered or displayed there.
NOTE: Tableau treats each individual cell as a mark, so each mark is needing to be calculated and rendered by Tableau.
When you can, limit the initial mark load so that you’re only loading the things the user cares about but still allowing them to click through for more details. For those marks, you want to make sure you are only adding data to the LOD shelf that’s relevant there. Design your dashboard for the funnel approach we mentioned above using cascading filters.
Some changes with the latest version releases of Tableau are that too many worksheets can affect performance, but this is not as true as it used to be. The Tableau Performance Recorder is a great asset in pinpointing those issues, but as a designer, it’s your call as to what you may need to sacrifice.
Performance Recorder
To access the Performance Recorded in Tableau Desktop, navigate to Help > Settings and Performance > (Start/Stop). In Tableau Server, your Server Admin will have to enable it on a site-by-site basis.
An area where we saw some huge system-wide performance impacts was in dashboard sizing. Ideally, we would recommend you avoid automatic sizing on dashboards, and fix sizes to meet the needs of the majority of users. Whenever you are doing that, Tableau is then caching all of the unique sizes and making the cache lookups more complex, which will be highly fragmented across all users. The impact of this was probably a lot larger than we were expecting in testing.
A factor that doesn’t often get talked about but does have an impact on initial loading times is the size of your workbook and the number of sheets in a workbook. Authors tend to create a collection of dashboards and organize them together, but when you do that, Tableau puts resources into loading all of the dashboards whilst you’re still viewing the first depending on how it is configured. We recommend having separate workbooks but connecting them in Server using URL links. Also, when possible, avoid using Show Tabs as that is a known issue that will result in them loading slower.
Just the Essentials
Still too much? Here’s an even briefer summary of this brief summary:
7 Takeaways
- Workbook size matters because of how VizQL works
- Watch your data size and use embedded extracts if possible
- Used fixed-size dashboards
- The new relational model can help
- Native functionality isn’t always faster (CASE statements) but may cache better (sets)
- Don’t display to save processing – Top N or Show/Hide button
- Strings vs. Int really doesn’t matter anymore, yay!
One Weird Trick
Embedded extracts are faster! Tableau does additional optimizations when an extract is local to a workbook. This helps improve things like filter performance.
Additional Quick Tips
- MIN and MAX are faster than AVG and ATTR
- Use IN instead of OR
- Be careful with nested calculations
- Avoid Count Distinct
- Avoid Show Tabs – long-time known issue
More Resources Made for Efficiency
Eager for more information? Check out these other resources and – of course – watch the webinar replay below (broken out by region):
Webinar Replay – US
Webinar Replay – APAC
Webinar Replay – EMEA