Date comparisons are one of the most common queries to hit our InterWorks Assist team. Whether you’re in finance, sales or a call centre, you’ve no doubt been asked to compare results in a current period to those in another period. This two-part blog series will guide you step by step through how to build (and continue to build upon) these comparisons, with the second part detailing how to visualise the results.
If you’re comfortable with this process or are just here for the template, you can download a copy here.
Big thanks to my colleagues at InterWorks for their support and feedback on this blog series, particularly David Siegel for being my proofreader and critical friend.
Get Started with the Build
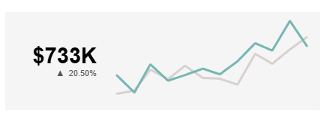
We’ll start with our basic use case. We want to build something like the below …
… but we want the user to have maximum flexibility to choose current and comparison periods:
Like many things in Tableau, the key here is to take it one step at a time.
Step 1: Build Our First Parameters
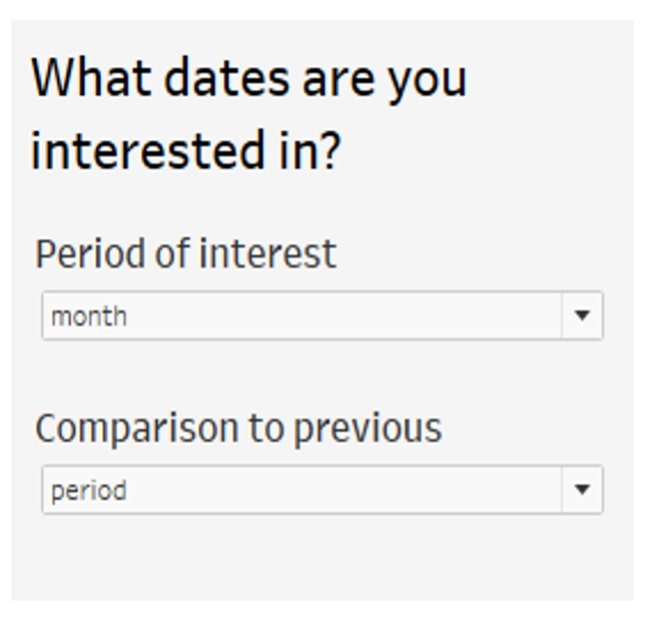
This is what your user is going to use to drive the dashboard. Parameters are great tools – your user can pick what they are interested in, and if you need to add something else to the list in the future, you can! For now, we’ll make parameters with our core items.
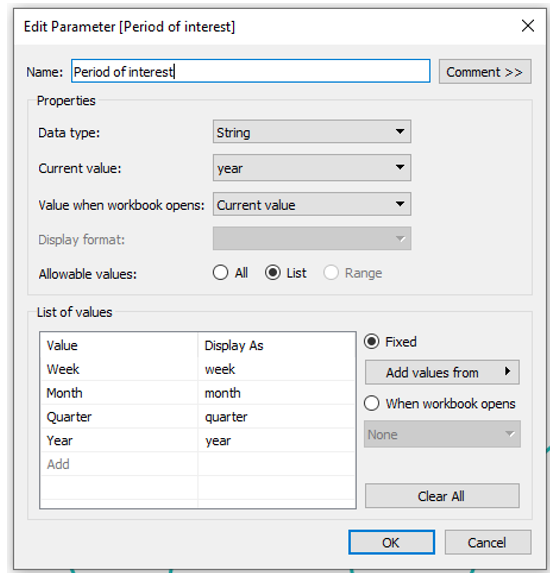
1. Period of Interest
Make one parameter for the period of interest:
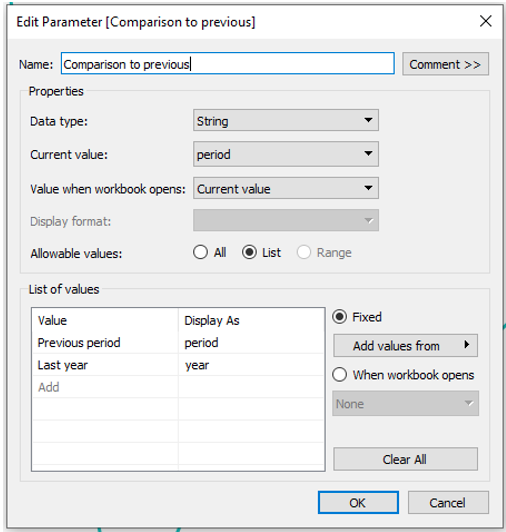
2. Comparison Period
And another parameter for our comparison groups:
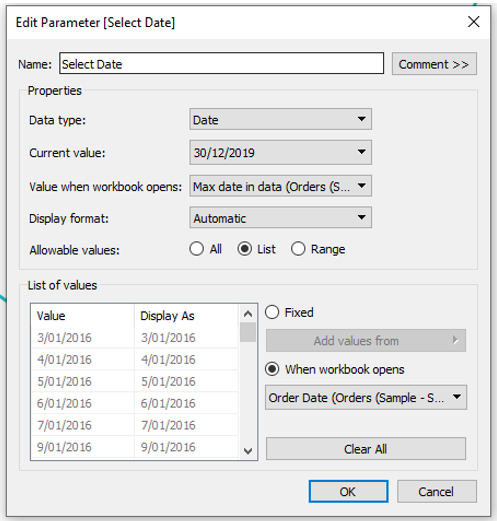
3. Select Date
We’re going to make a parameter for Select Date. I’ll set this as a dynamic parameter and have a range based on my data. This lets me set a default for the most recent order date but also pick a date in the past if desired. While I might not need this straightaway, it future-proofs my dashboard for the user who asks, “What if I want figures for January 2017?”:
BONUS Parameters!
These are nice to have additions and will give us a lot of flexibility in future.
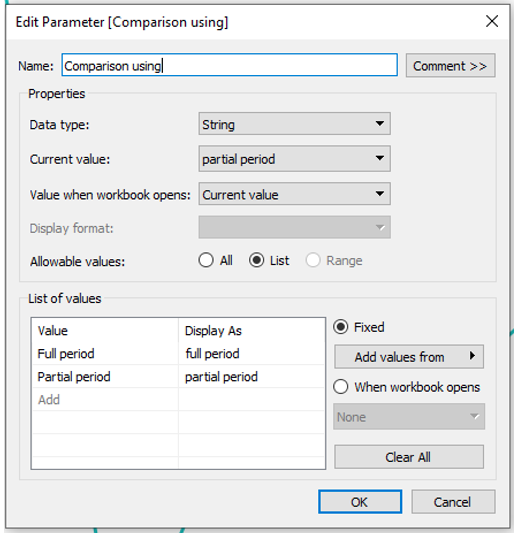
4. Full or Partial Period
This allows the user to choose, for example, if they want to compare the month ending 16/03/2021 to the full month prior (ending 28/02/2021) or the prior month to the same date (ending 16/02/2021). You may not need this bit if you’ve got a clear view on the one you’ll be using, but I like to future-proof my dashboard in the case of a person asking for the one you inevitably didn’t build:
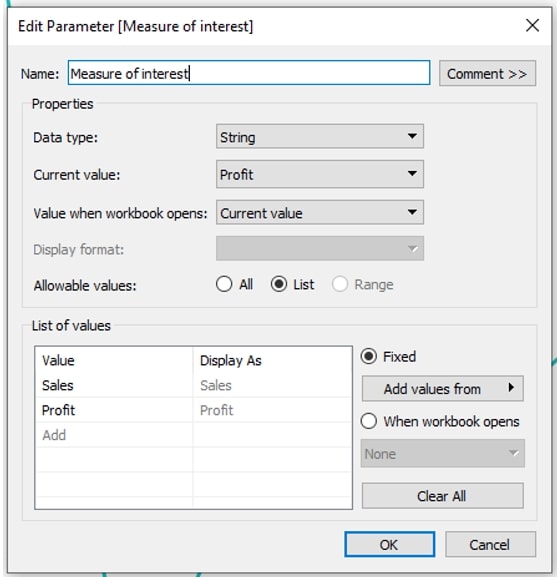
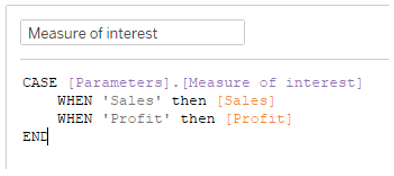
Measure of Interest
Finally, we’re going to create a parameter to swap between our measures. This is for when someone likes your dashboard so much that they want to look at profit instead of sales:
Step 2: Current Period
We’re going to build a few calculations for the current and comparison periods. We could just build one giant calc, but doing it in steps lets us see each calc on its own, allows for QA more easily and makes future edits easier to track down.
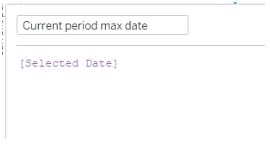
1. Current Period Max Date
The first calculation turns our parameter selection for Selected Date into the max of our range. Technically, we could skip this calc, but I like to have it for clarity:
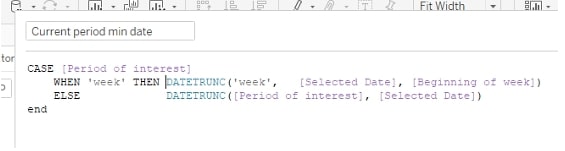
2. Current Period Min Date
This depends on what the user selects. The DATETRUNC formula works by capping the date to the first of that range e.g., if I DATETRUNC the date (16/3/2021) to the month, I get 1/3/2021. We’ll build a formula that truncates our max date (the parameter Selected Date) by the period we’re interested in:
Step 3. Comparison Period
This is a bit funkier. Our calculation needs to consider whether we’re comparing to:
- the last period (e.g. February 2021) or the same period last year (e.g. March 2020)
- a partial or full period (e.g. March to 16/03/2021 to all of Feb 2021, or Feb ending 16th?)
Again, we’re going to build this in steps so it’s easier to QA.
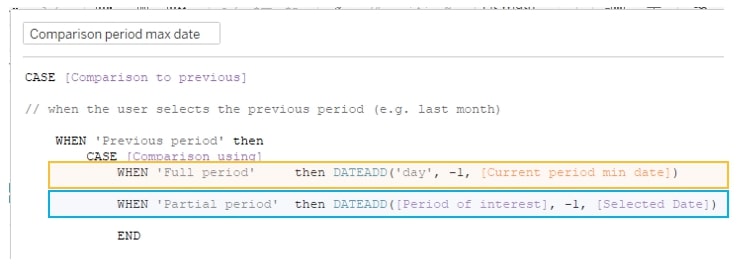
1. Comparison Period Max Date
This is our hardest calc, so bear with me. First, let’s discuss last period (e.g. month ending 16 March 2021 vs. Feb 2021). The maximum date for the previous period will depend on whether we compare to the full prior period or the prior period ending on the same day.
- For a full prior period, take a day off the minimum of the current period (e.g. go from 01/03/21 to 28/2/21); orange section below
- For a partial period, go back a period from the [Selected Date] (e.g. go from 16/3/21 to 16/2/21); blue section below
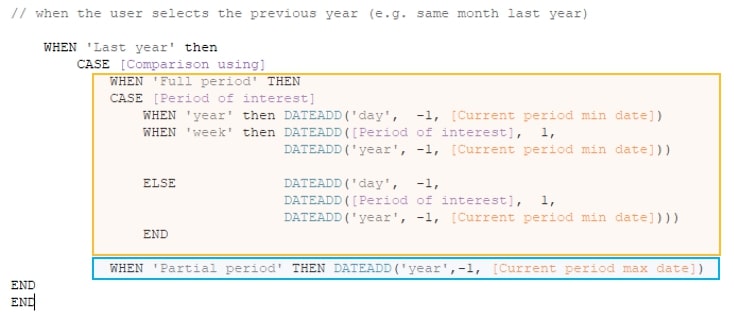
Now, we’ll do the previous year option. Again, the exact date depends on whether we compare to the full period (March 2020 ending 31st), or the period ending on the same day (March 2020 ending 16th):
- For the full period, the calc is a bit different depending on the period you’re interested in; orange section below
- For a partial period, take a year from the [Selected Date]; blue section below
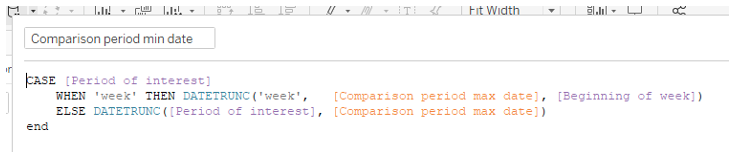
2. Comparison Period Min Date
Finally, the min date for our comparison. This one is easy – we’ll just truncate our max date based on what the user is interested in (week, month, quarter or year) with that reference for the beginning of week for the weekly period:
Step 3: Final Calculations
Now, we’re going to make these into calculations we can reference, starting with our measure of interest:
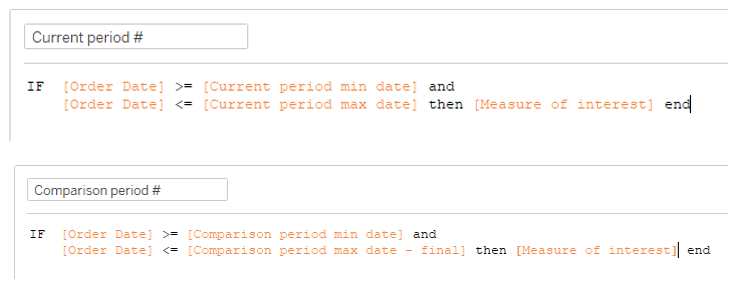
And now we can create current and comparison period numbers:
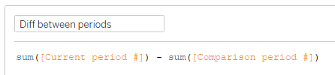
And finally build some comparisons – raw:
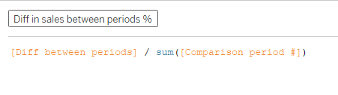
And percentage change. Don’t forget to format this field as a percentage!
Quality Assurance
Before we get too far into the fun visualisations, let’s put something together so we can easily QA. Date comparisons like this can be tricky to get just right, and this will give us a way to see if it’s working as expected.
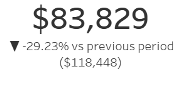
If you want to download and reverse-engineer anything, here’s the template. I’ve also included it as a downloadable resource below. And be sure to check back for my next blog where I discuss ways to visualise these results. Teaser below!