
Sorting a single table is easy in Tableau Desktop, although the degree of control varies from method to method:
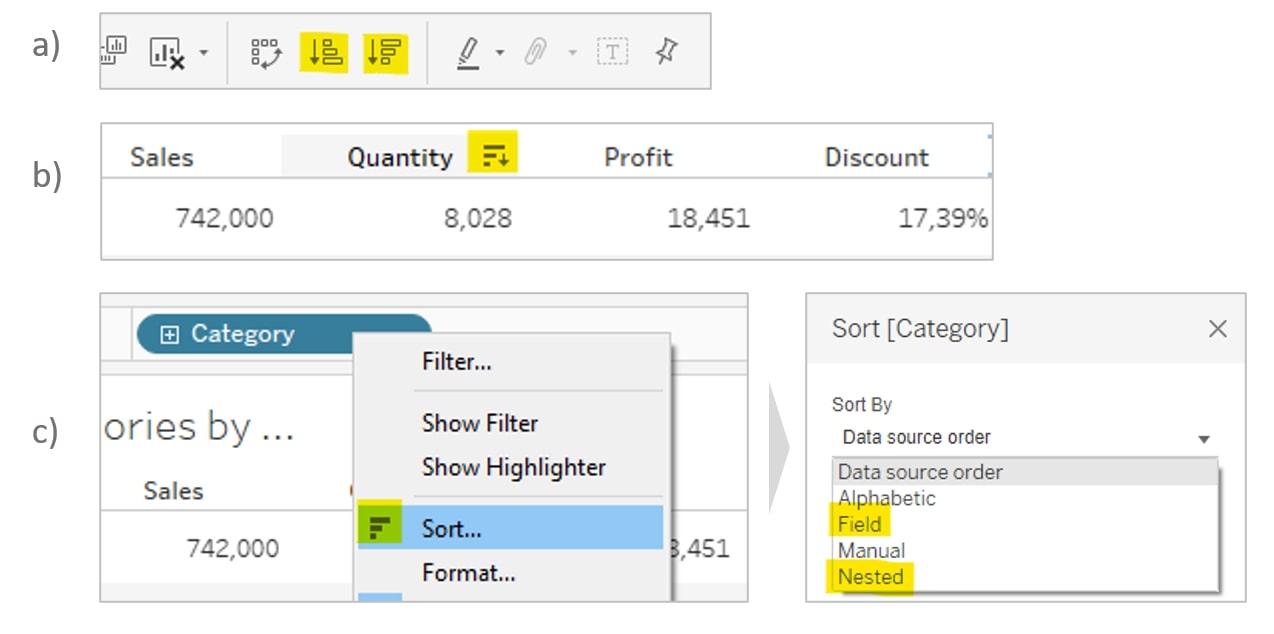
- Click on the Sort button in your top menu.
- Click on the Sort button next to your column/row header.
- Right-click on the dimension on Rows or Columns and click Sort.
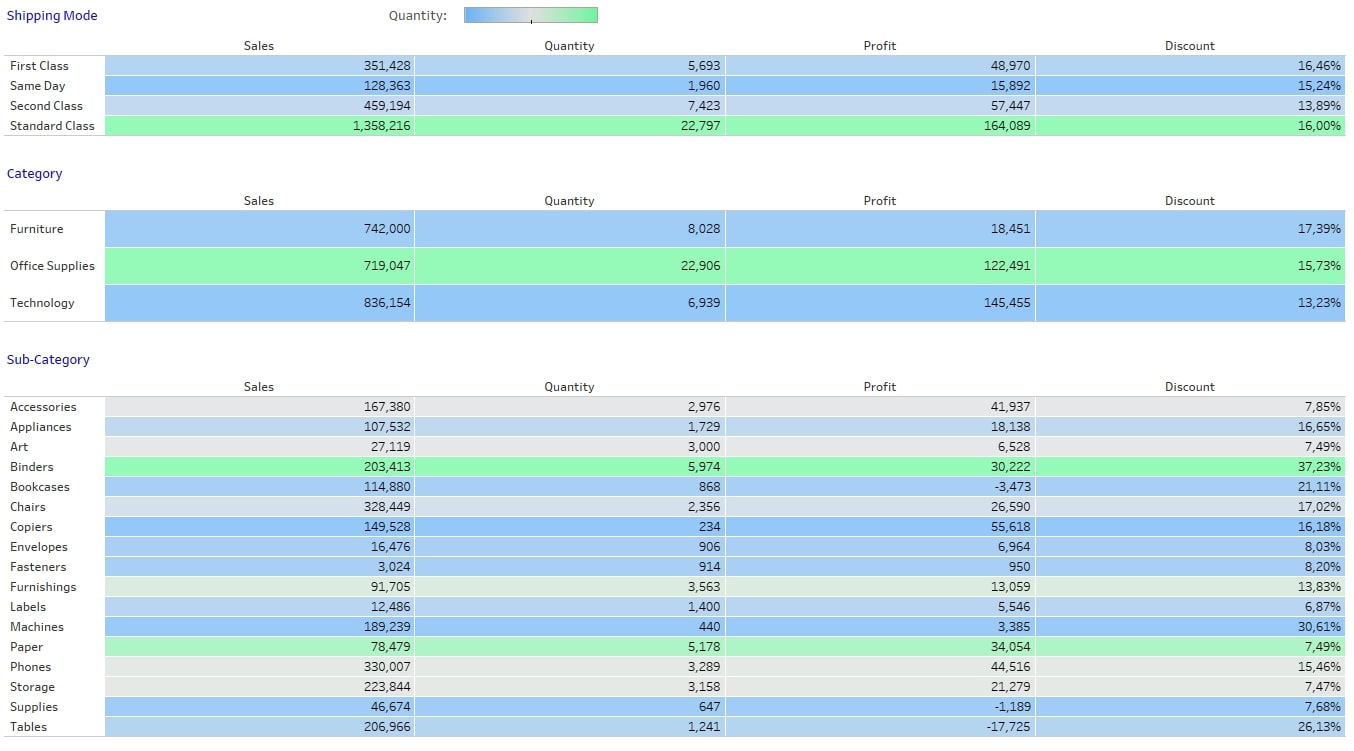
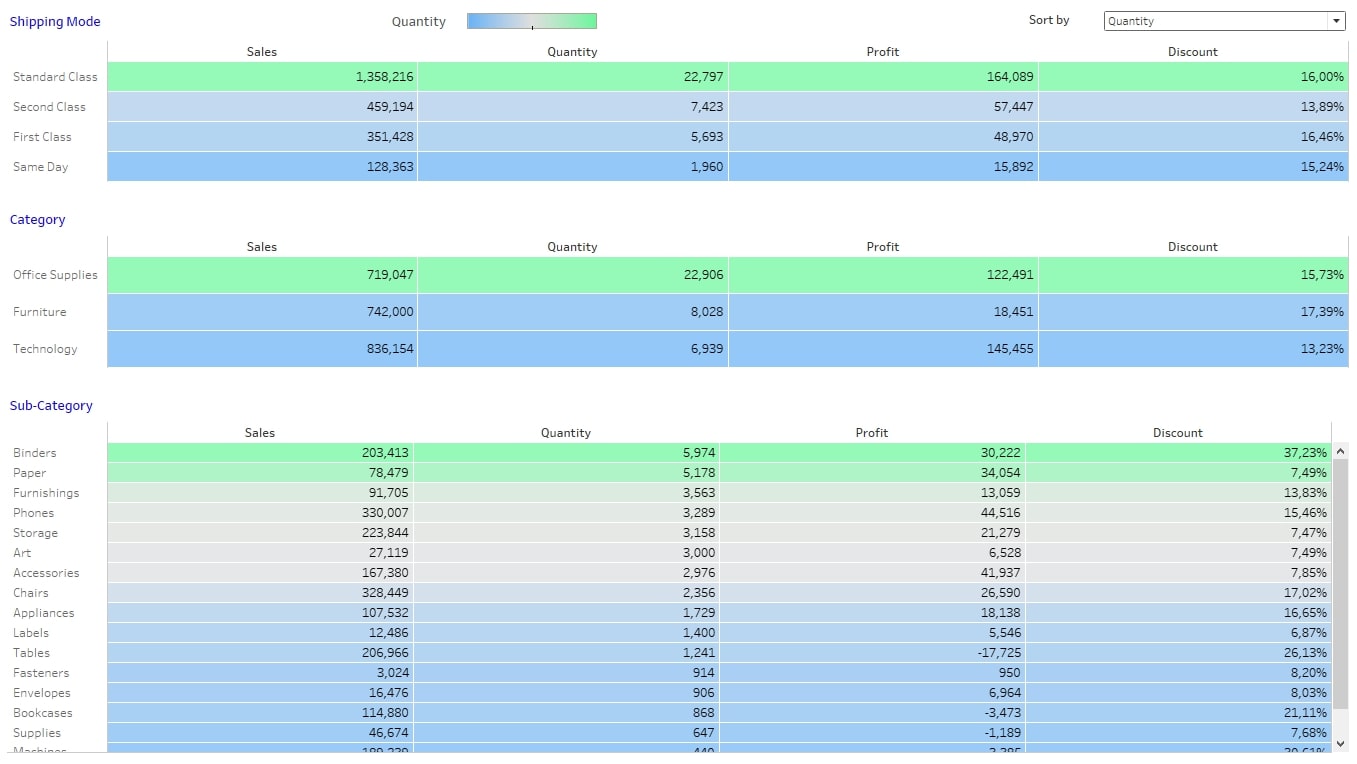
But what if we want to sort not just one table on a dashboard but two, three or more? And what if we want to do it all with one click? Take these example tables that are built with Tableau’s Global Superstore data:
Here it gets a bit trickier than just using a sorting button. But don’t worry—it’s absolutely possible, and we actually don’t need a lot to do this. Just a few things:
- A parameter
- A calculated field and a RANK() function
- Putting it all together
So, let’s go through this step by step. We have three tables in our dashboard above, and each has four measures in there: [Sales], [Quantity], [Profit] and [Discount]. In the end, we want to be able to sort all three tables by one of the four measures with just one click.
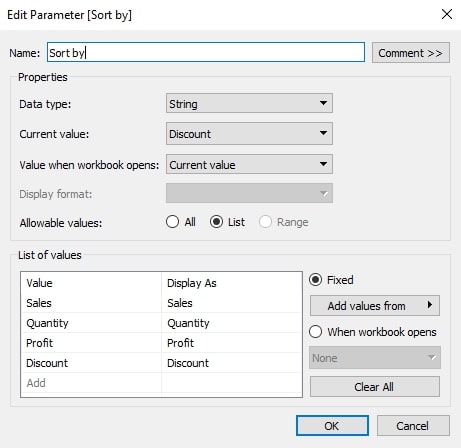
Step 1 – Create a Parameter
First, we need a parameter. Right-click on the white space in your Data pane on the left, or go to the little dropdown to the right of the search field in your Data pane, then choose Create Parameter.
Let’s name it Sort by and set the data type to String. (You could set it to Integer as well, and yes, integers are by far more performant, but I want to use a parameter action later on that uses text, so I’ll stick with string as data type.) Click on List for allowed values, and as we have four measures, type them all in:
Step 2 – The RANK Function
In our second step, we need a calculated field and two functions. We start with the CASE function, which calls our freshly built parameter and checks what is in it. Then for each possible element, we write out a rank function.
Tableau offers five different rank functions, all of which have their merit. In our case, let’s take the variant RANK_UNIQUE(). This rank function gives every element in our table a different or unique rank. If there are two equal numbers somewhere, the function still designates two different ranks.
And here’s the trick of this article: We want to use this ranking of our dimension as a field to sort by. So, let’s create a calculated field, name it Sorting and type in:
CASE [Sort by]
WHEN 'Sales' THEN RANK_UNIQUE (SUM([Sales]), 'desc')
WHEN 'Quantity' THEN RANK_UNIQUE (SUM([Quantity]), 'desc')
WHEN 'Profit' THEN RANK_UNIQUE (SUM([Profit]), 'desc')
WHEN 'Discount' THEN RANK_UNIQUE (AVG([Discount]), 'desc')
END
Tip: If you want the user to be able to switch between ascending and descending, you may just add another parameter – again with the data type String – and put in asc and desc as allowed values and place this parameter in our calculated field, instead of the written ‘desc‘. Don’t forget to show its parameter controls on your dashboard in the end.
Be mindful of the aggregation for [Discount]. This measure is a percentage, so adding it up would not make much sense. We use the average for that one.
Once we click on OK, let’s right-click the new field and convert it to discrete.
Step 3 – Put It All Together
Now, we go into each of our three tables and add this new field onto Rows, so our table is listed in a numerical order:
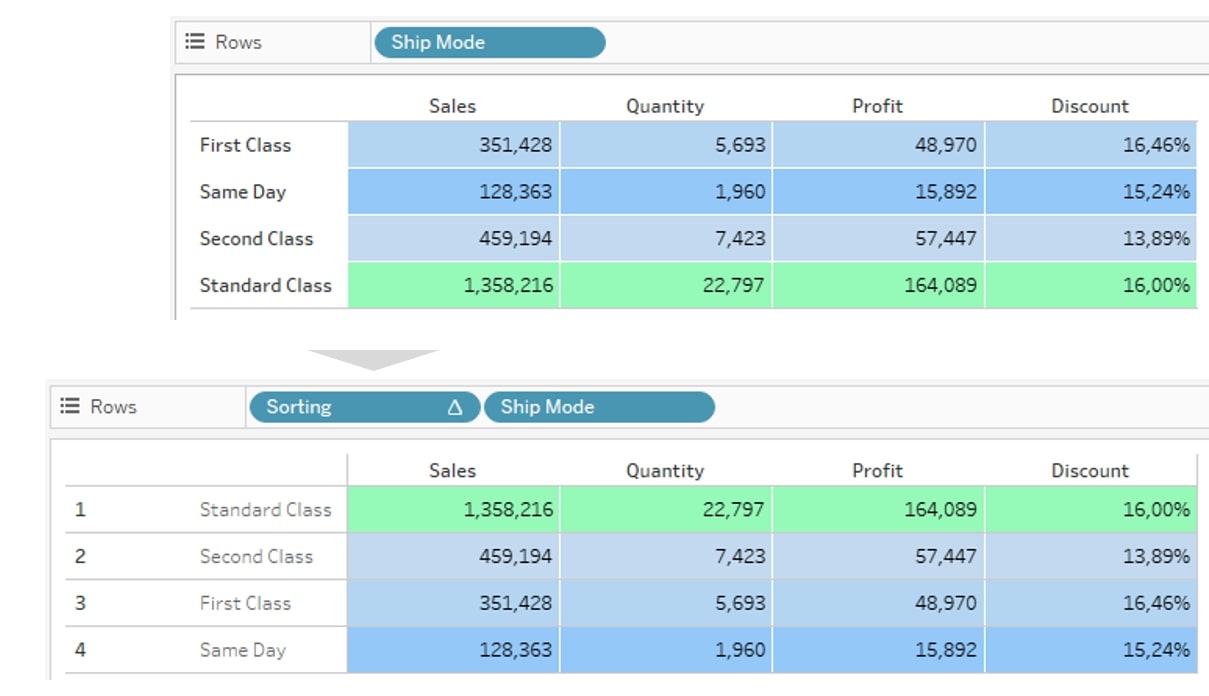
Right-click on the blue Sorting pill and untick Show Header. This way, our table is still sorted, but we won’t see the numbers anymore … they are kind of distracting. Also, you may notice that Tableau automatically adds a grey border between our rows once we have more than one header on Rows. Remove them via the Format menu, if you like.
Once we have done that for all three tables, let’s get back into our dashboard and show the parameter that we created:
And there we are! One parameter controlling the sorting in all our tables at once!
Make It More User Friendly
Of course, this is just the beginning. If we want this sorting to be user-friendly and offer a more seamless user experience, we will need to go one step further. So, let’s say we don’t want our user to click on this parameter in the upper right to choose a measure to sort by. Instead, we want him to click directly onto the column headers or even onto any value of a specific column.
This feels far more natural and is easy enough to build. All we need is a parameter action that drives our parameter after we click on something. For this, we click on the menu item Dashboard > Actions:
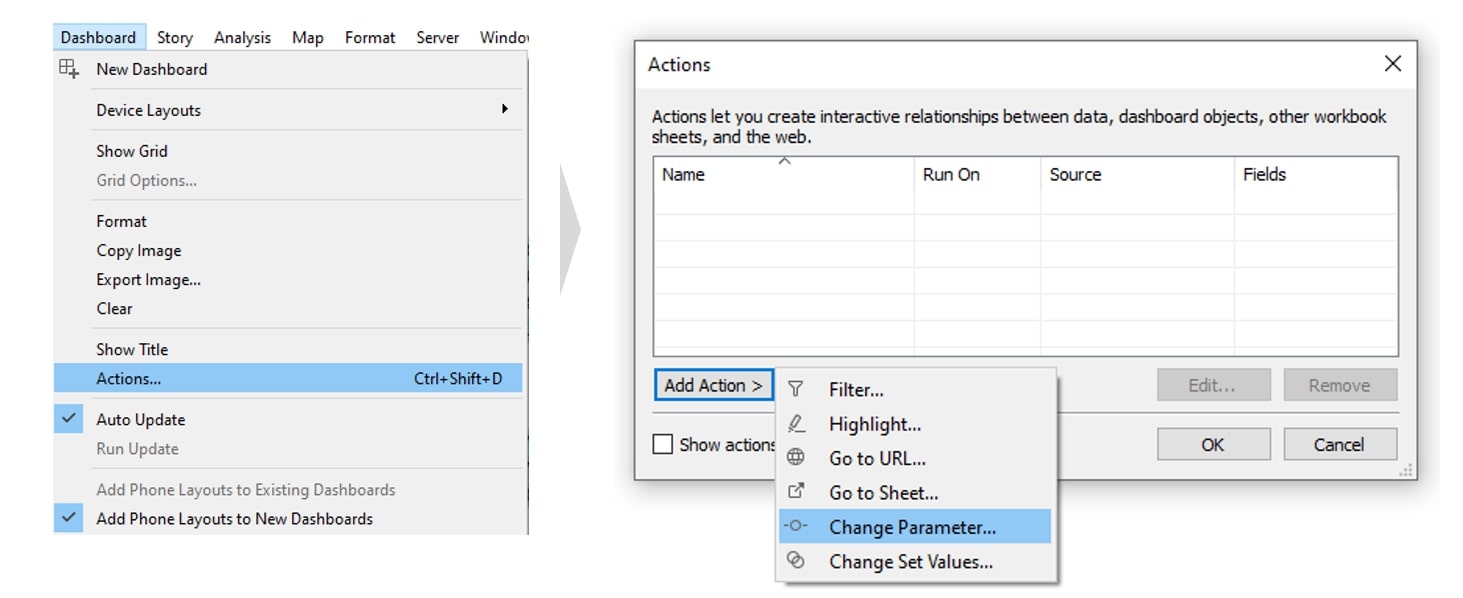
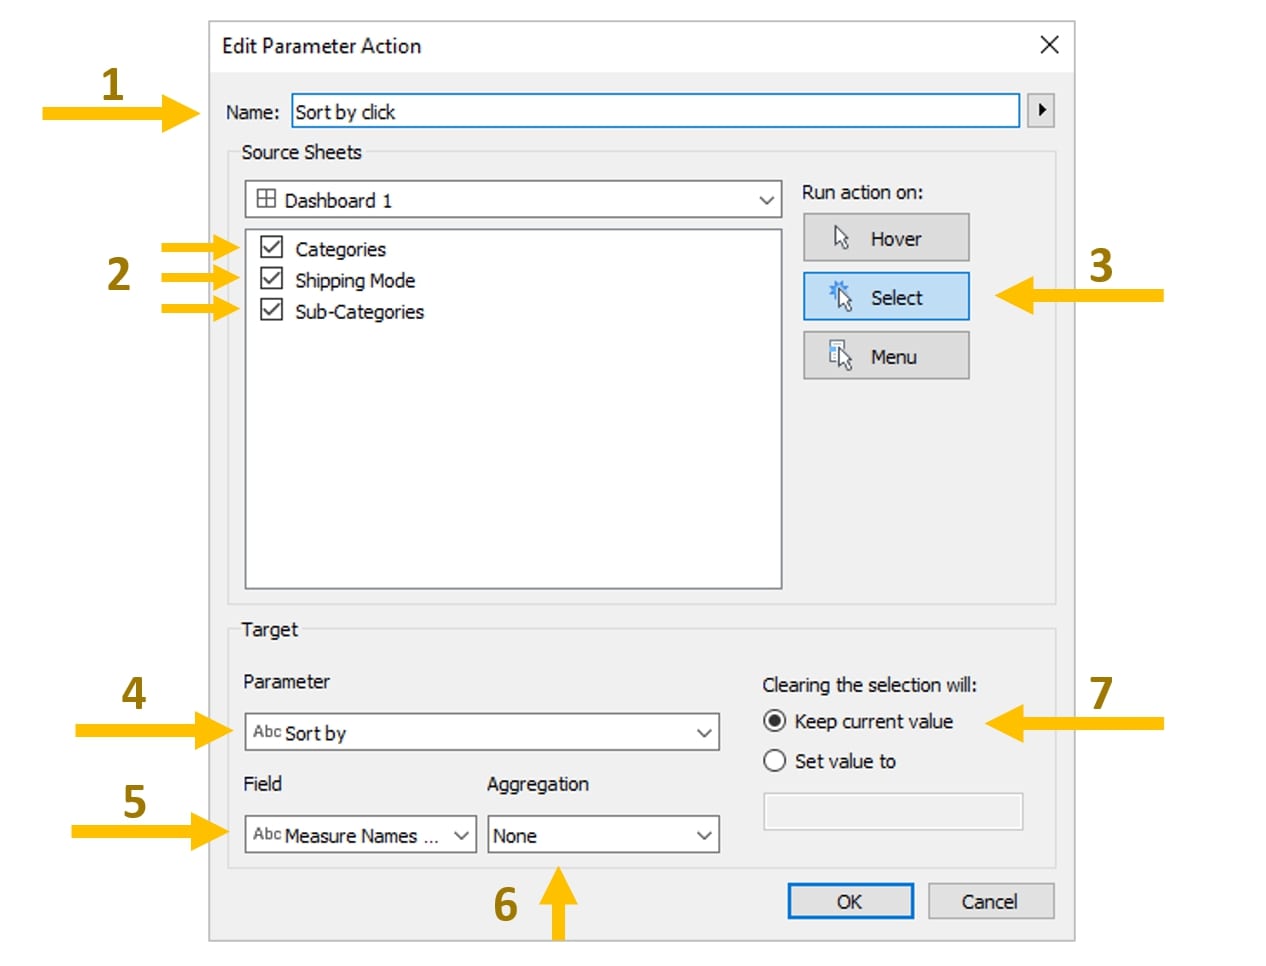
In our new dialog box, we create the parameter action. Here are the steps in the process:
- Give it a proper name. Especially when you have several actions on a dashboard, you’ll thank yourself for being that disciplined!
- Select the dashboard and sheets we want to use to fill the parameter. In our case, I use all three sheets as a source because I want my tables to sort whenever I click on a number on my dashboard.
- On the right, I choose Select. Don’t use Hover here as this gets very messy very fast. (Or hey, on the other hand – have some fun and try it!)
- Select the parameter we want to change its value by clicking.
- Select the field on our source sheets that provides the value for the parameter. In this case, when we work with the header titles of Measure Names, we can use exactly that as field.
- Our parameter action does not need an aggregation as we will just hand over the strings of our measures. So, keep the None here.
- Clearing the selection means: When we deselect the field we were clicking on in our source sheets, what value should the parameter take? Here, we want to keep the last selection, but you could set it to “Quantity”, for example, if you want this as your default sorting.
Let’s click on OK and in the action overview as well. Hot tip: Never leave the action overview by clicking the x in the upper right! That discards every change you made.
At the end, I like to clean up a bit (hiding unnecessary headers and field labels, for example) and give the user a hint on how to handle the dashboard:
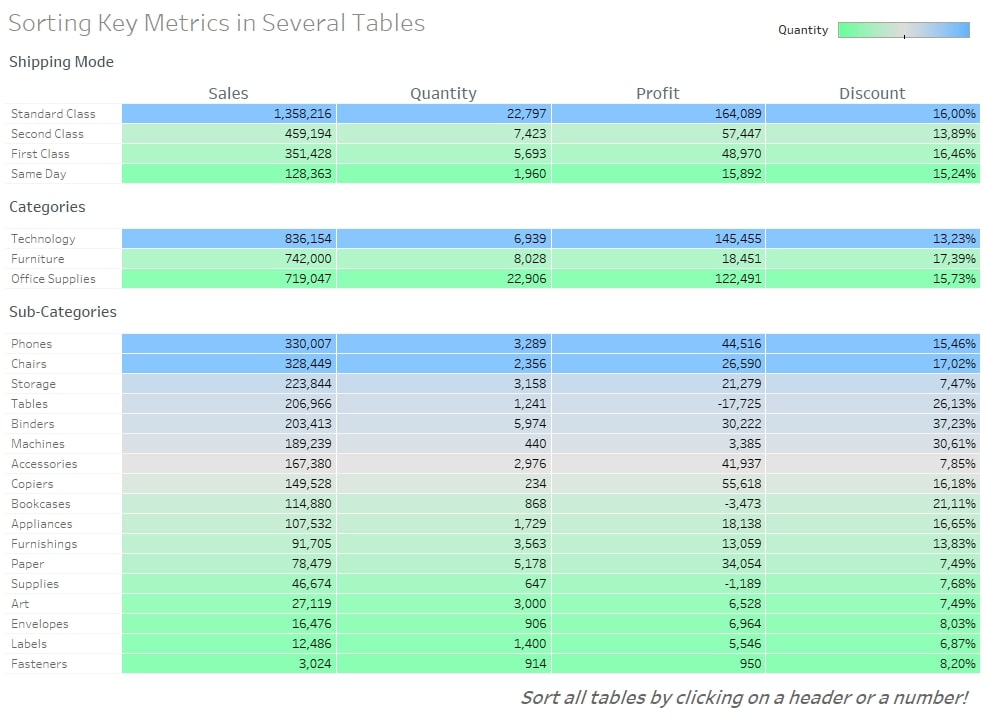
Now when we click on one of the headers, this click will fill our parameter on which the four different rank functions are based – and all tables get sorted at once.
I hope that helped a bit! If you have any questions about all this, please remember you can always reach out. We’d love to help!