Creating high-quality work in Tableau is one thing. Creating that high-quality work with less effort and more efficiency is something else altogether. This blog explores our team’s go-to methods for logical naming conventions that streamline your work in Tableau and help make the process repeatable and intuitive, so you can drop in at any point and pick up right where you left off.
One important element of “future-proofing” your Tableau work is to include documentation and notes throughout your workbook that you can reference later. If you work in a larger organization, this can be especially helpful—if everyone gets on board with the same standards for things likes sheet and calculation naming, you’re going to have a much easier time sharing the development of your workbooks over time.
The keys to a well-organized workbook are consistency and clarity. If you have these two things, you’ll be good to go. Below, we will outline some of our consultants’ best practices for ensuring you can achieve this in your workbooks.
Calculation Organization
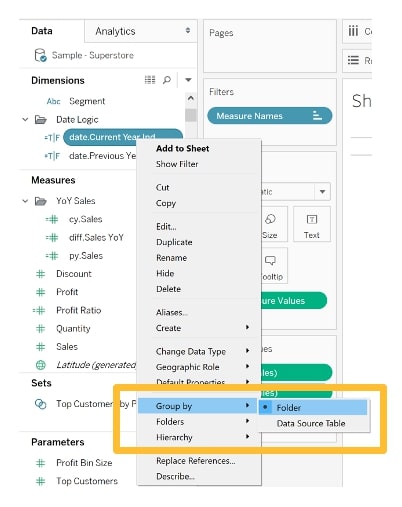
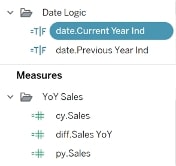
Use Tableau’s Group by Folder feature to organize related calculations together.In the example below, I have grouped my Date Logic calculations together, as well as the calculations for Year Over Year (YoY) Sales:

We also recommend using some standard prefixes for calculations to indicate their usage. This also makes them easier to find in the Data pane. A few we like:
- pm. = calc to define a parameter
- cy. or cfy. = current (fiscal) year
- py. or pfy. = previous (fiscal) year
- diff. = calcs that show difference between cfy and pfy
- date. = calculations related to dates
- label. = calculations created specifically for labeling charts/views

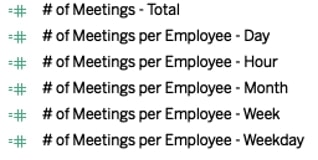
Depending on the extent of your calculations and how you have them arranged, you could also use these labels, or similar descriptors, as suffixes. Here is an example of how that may look:

A disclaimer for the prefix/suffix suggestion: Depending on your type of viz, these calculation names could appear in your view (i.e. if you are using them in a crosstab). In that situation, it may be better to forgo the labels in the name and use the Folders grouping method outlined above.
Sheet Organization
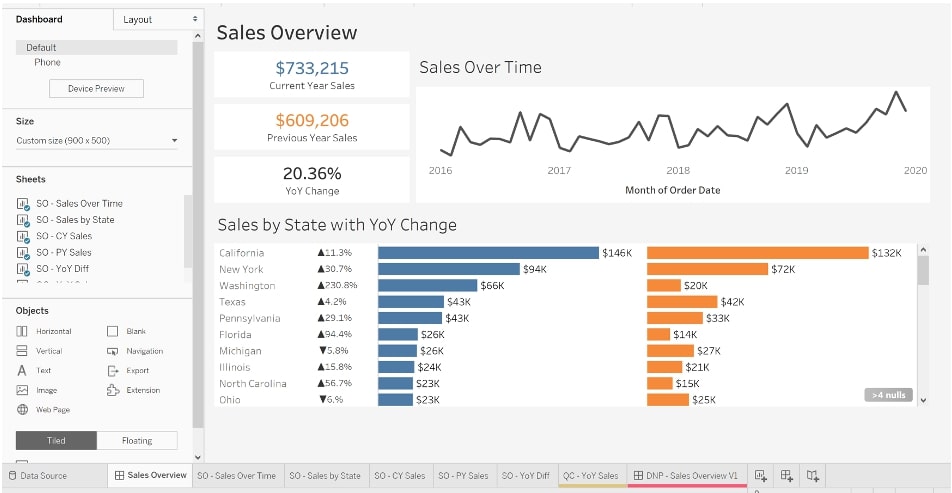
We recommend naming your sheets with a short descriptor of what is on them, prefaced with the acronym of the dashboard tab they will exist on. For example, if your dashboard is named Sales Overview, then each of your dashboard tabs would be named something like “SO – Sales Over Time” or “SO – Sales by State”, etc.
This makes it easier to find all your sheets grouped together in the Sheets pane when you add them to your dashboard. It also proves beneficial when you have many dashboard tabs with many sheets for each tab. No more guessing where each sheet ends up.
We also recommend using a mix of acronyms and the Colors feature for tabs to denote some key visual cues for your developers:
- Worksheet Tabs that are NOT on a dashboard
- They should lead with either:
- QC – tabs that are meant for quality-control purposes only (ex: crosstabs to check calcs, data quality, etc.)
- TEST – tabs that are designed to test out a concept or viz type
- Also colored Yellow (see below)
- Dashboard Tabs that are not meant to be published
- Start with DNP for “Do Not Publish”
- Also colored Red (see below)
- They should lead with either:

Tab Colors
- Tabs can be colored or left clear if they are going to be published. (Note: tab colors don’t appear to end users on Tableau Server)
- The two colors we recommend using as visual cues to know tabs are NOT for Production are red and yellow:
- Red – DO NOT PUBLISH – to denote a tab that easily looks like it could be publishable for users, but it shouldn’t be
- Yellow – QC / TEST
Tab Organization
- Hide all sheets that are on dashboards before publishing
- All worksheets that are to be published should be on a Dashboard tab
Below is an example of these suggestions in practice in a workbook:

For more on documentation within your workbook, check out these other InterWorks blog posts:
I hope you found these tips helpful, and a few of them prove to save you some time and effort in your Tableau process. Good luck in your work!

