If you are transferring a dashboard from Excel to Tableau, and the Excel file uses the PERCENTILE.INC and/or the PERCENTILE.EXC functions, this is how to handle them in Tableau.
Some Basics of Percentile Calculations
There are several different methods of calculating a percentile score, but there are a couple of basic concepts that apply – NEAREST-RANK or INTERPOLATED, and INCLUSIVE or EXCLUSIVE.
The NEAREST-RANK options means that, once you have calculated the rank of the number that represents the percentile you are looking for, you only use the whole number calculated and select the score that is at that rank.
The INTERPOLATED option means that, once you have calculated the rank of the number that represents the percentile you are looking for, you then calculate exactly the score that lies between the scores that the rank points to.
With both the above methods, the calculation of the RANK is important, and this can either be an INCLUSIVE calculation or an EXCLUSIVE calculation. An INCLUSIVE calculation includes the score at the rank calculated. An EXCLUSIVE calculation excludes the score at the rank calculated.
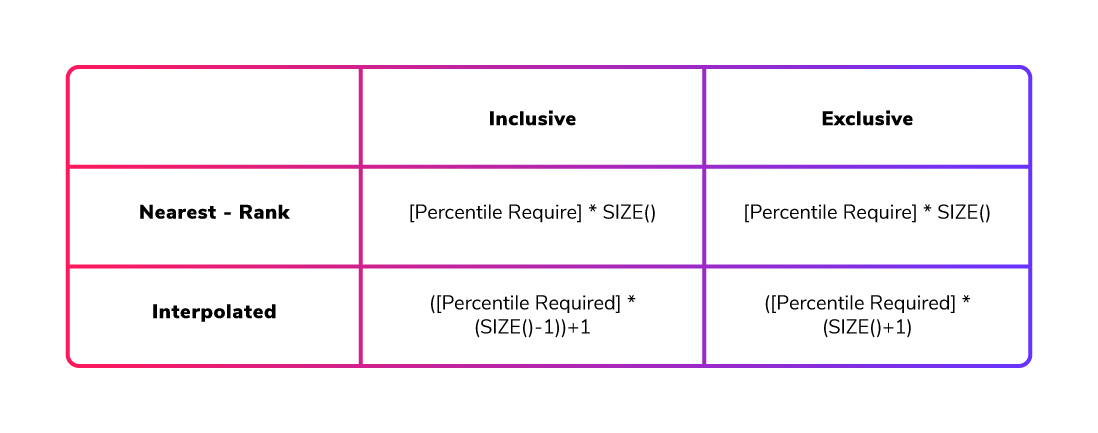
Below is a matrix of how the RANK is calculated for the different options:
![]()
Here, N is the total COUNT of values in your set of numbers. For the INTERPOLATED method, if the RANK calculated by the formula is a whole number, the score at that RANK is the percentile score.
How Do the Excel Functions Work?
With the above knowledge, the Excel functions can be categorised. As their names suggest, one uses an INCLUSIVE calculation and the other an EXCLUSIVE calculation, and both of these functions provide an INTERPOLATED result.
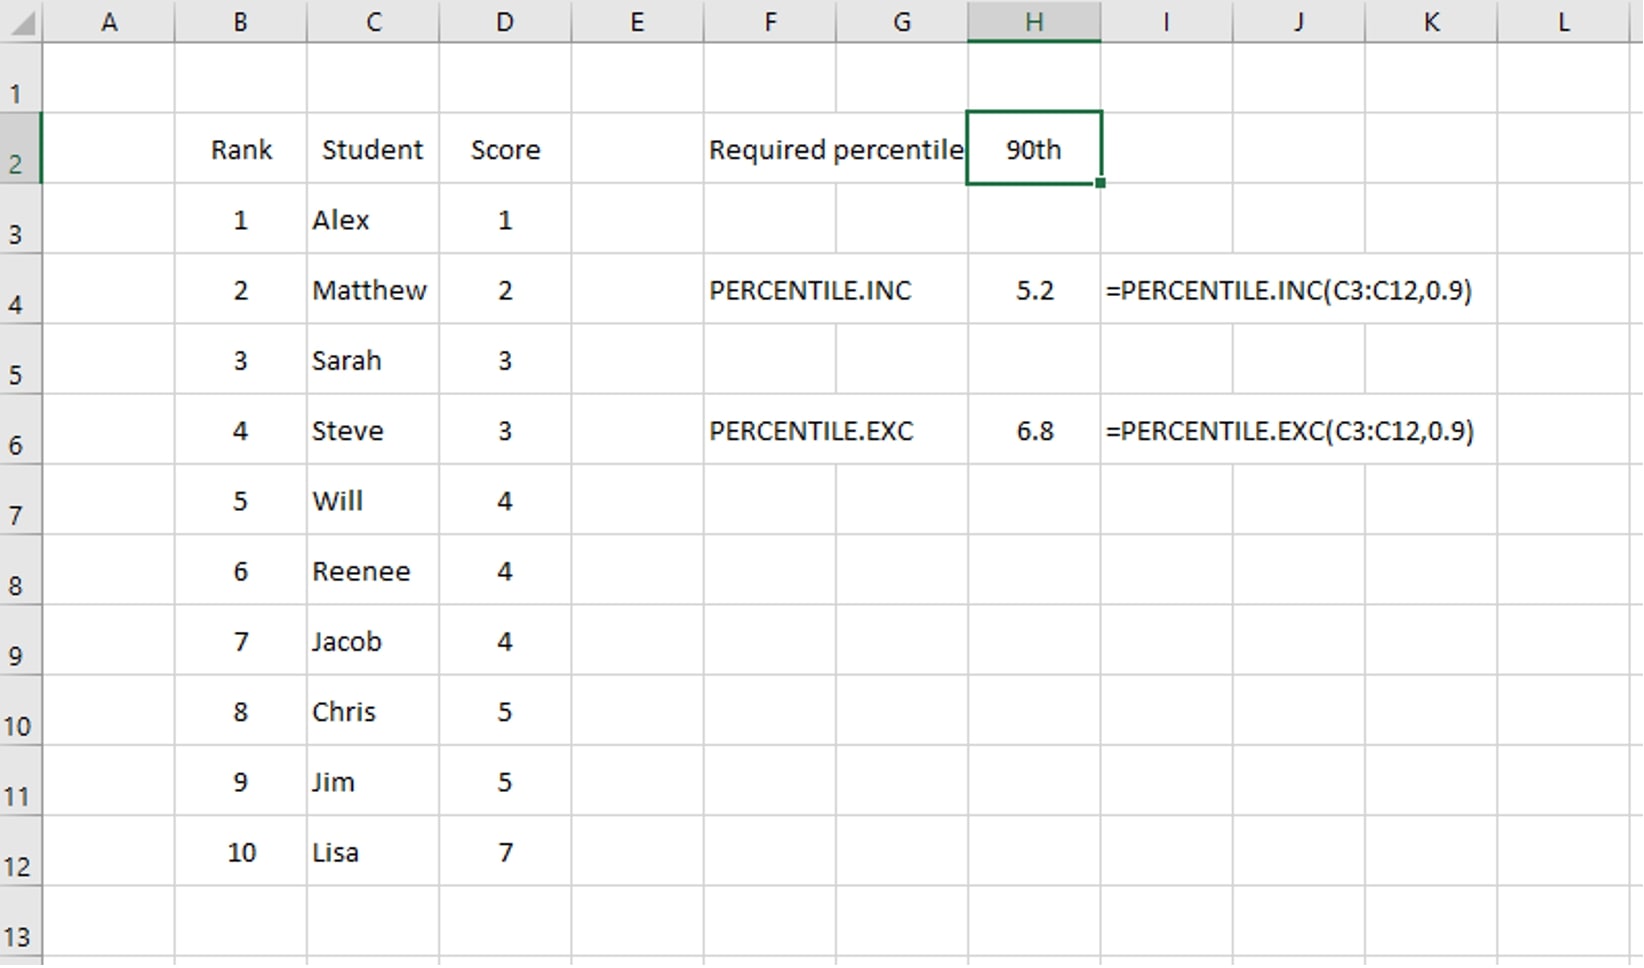
Therefore, if we have the following list of students’ scores—1, 2, 3, 3, 4, 4, 4, 5, 5 and 7—we can see the percentile scores from the different functions in Excel when calculating the 90th percentile. PERCENTILE.INC gives an answer of 5.2, while PERCENTILE.EXC gives an answer of 6.8:
To check these values, if we calculate the RANK for each option, we get the following results:
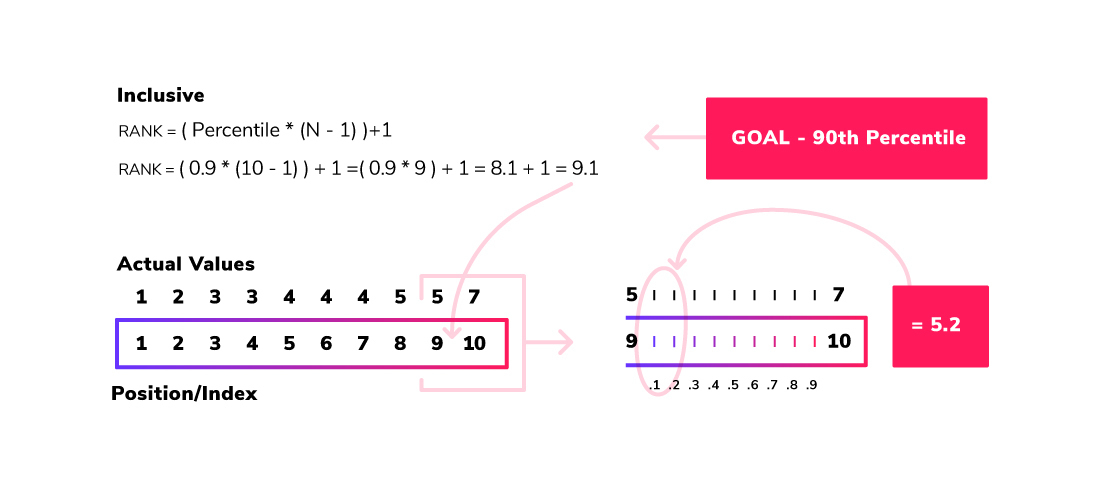
INCLUSIVE calculation
RANK = ( Percentile * (N – 1) ) + 1
We have 10 numbers in our set so this gives us:
RANK = ( 0.9 * (10 – 1) ) + 1 = ( 0.9 * 9 ) + 1 = 8.1 + 1 = 9.1
EXCLUSIVE calculation
RANK = Percentile * (N + 1) = 0.9 * (10 + 1) = 0.9 * 11 = 9.9
With an INTERPOLATED method, we know that the answer is a number between the scores at the whole number ranks either side of our calculated rank; in this case, it’s between the values at the 9th and 10th values in the list (ranked from smallest to largest). Looking at the data above, the 9th value is 5 and the 10th value is 7.
For the INCLUSIVE calculation, with a calculated rank of 9.1, the percentile score we are looking for will be 1/10th of the way between our two values. The difference between our values is 2; therefore, our answer is 5.2:
For the EXCLUSIVE calculation, with a calculated rank of 9.9, the percentile score we are looking for will be 9/10th of the way between our two values. The difference between our values is 2, so our answer is 6.8. Now we have an understanding of the two Excel functions and how to manually calculate them.
How Do the Tableau Functions Work?
In Tableau, there are two different functions that can be used: PERCENTILE and WINDOW_PERCENTILE. These calculations work on the data at different levels.
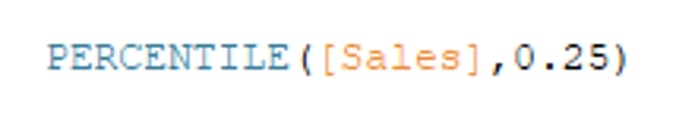
As expected, the WINDOW_PERCENTILE will calculate the requested percentile score based on the metrics/dimension(s) in the view. The PERCENTILE function (with no filtering) will calculate the percentile based on every value of the metric in the dataset. For example, let’s consider the sample Superstore dataset and look at the PERCENTILE function when applied to the SALES metric:
At the lowest level, let’s look at the sales for the Acme Box Cutter, Serrated in the Supplies product sub-category. There are three orders for this product and the PERCENTILE calculation will take the Sales value from each order and calculate the percentile score:
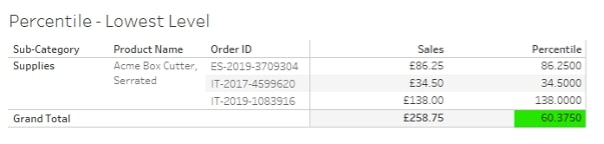
Calculating the 25th percentile score for these orders gives a value of 60.375. This is seen in the TOTALS row as each individual row just shows the ‘percentile’ for the value on that row.
Looking at the all the products in the Supplies product sub-category:
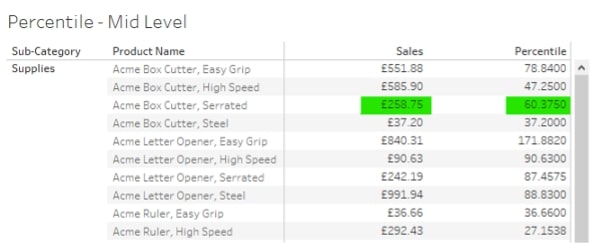
Here, as expected of Tableau functionality, the SALES value is the SUM of the individual order values for the Acme Box Cutter, Serrated, and the percentile score is calculated from the individual order values. All the other products on the list also have their percentile scores based on their individual sales values.
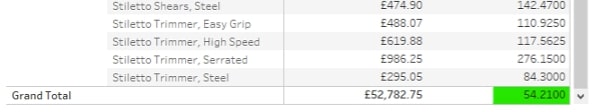
Looking at the bottom of this table, there is a percentile score for the view, but this score is still based on all the individual SALES values for all the products in the Supplies product sub-category. It is not based on the SUM(Sales) values seen in the visualisation:
At the next level up, looking at all the product sub-categories, the score calculated on the previous level is seen at the row level:
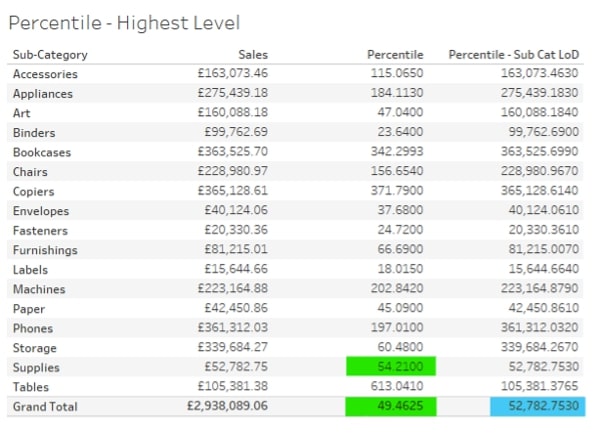
Here, the percentile score seen in the TOTALS row (green highlighted) is the 25th percentile score for all the individual sales values in the dataset, i.e. any individual sales value above that will be in the 25th percentile.
Looking at the values highlighted in blue, this is the same calculation but based on a level of detail (LOD) calculation that fixes the value of SALES as the SUM(Sales) at each product Sub-Category:
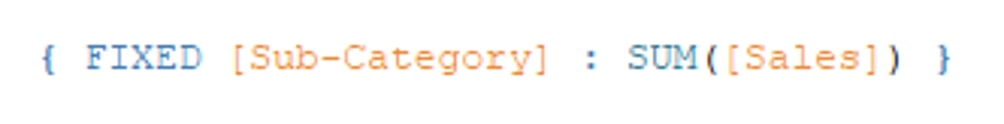
This LOD is then used in the percentile calculation:
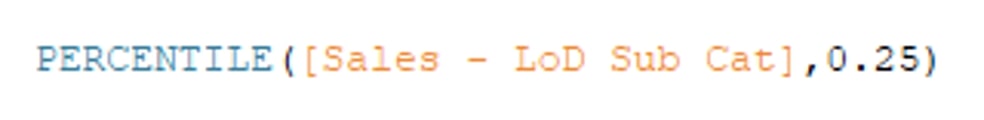
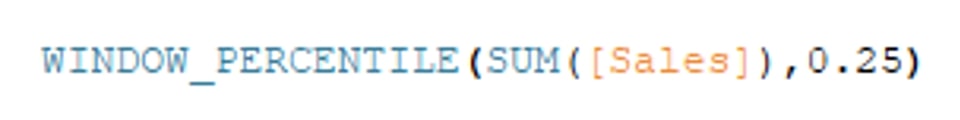
This gives a completely different percentile score – one based on just the sales at the product sub-category level. This is the same value that is returned if the WINDOW_PERCENTILE function is used:
Now that we’ve seen what standard functions Tableau has, we need to see where to place the calculation on the RANK calculation matrix. Firstly, below is the re-creation in Tableau of the data set seen above regarding the students and their scores and what is the 90th percentile score:
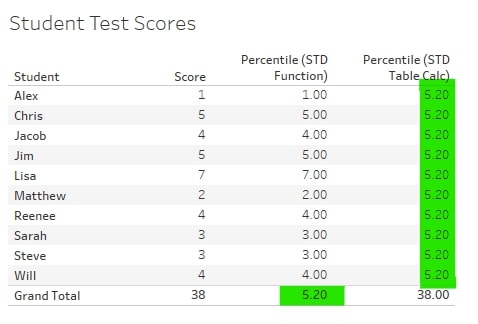
This visual shows the different ways Tableau presents the results of the two functions. The standard PERCENTILE calculation, as we saw above, will show us the percentile score for the data. In this case, there is only one score per student, so the percentile score is seen in the TOTALS row.
The WINDOW_PERCENTILE, being a Tableau table calculation, will calculate the percentile score in the table in the visualisation and display that score in each row of the table.
The results of both functions give a percentile score of 5.2. Referring back to the Excel snippet, this shows that the Tableau calculations are giving the same result as the Excel PERCENTILE.INC function, i.e. Tableau is calculating the inclusive, interpolated percentile.
Re-creating PERCENTILE Calculations in Tableau
As the Tableau standard calculations provide an inclusive, interpolated result for a percentile score calculation, we only need to recreate an exclusive calculation to be able to recreate an Excel dashboard that uses PERCENTILE.EXC function. However, the solution below will allow the recreation of any of the percentile score calculations outlined in the first section of this blog.
Step 1. Creating the Percentile Index
This is where most of the difference between all the different calculations lies. The constant part of all the calculations is the requirement to know N, or the number of items in our list of numbers. To make this methodology require minimal intervention each time it is used, the standard table calculation (TC) can be used:
![]()
So, the calculation for an exclusive percentile score for the Percentile Index would be this:
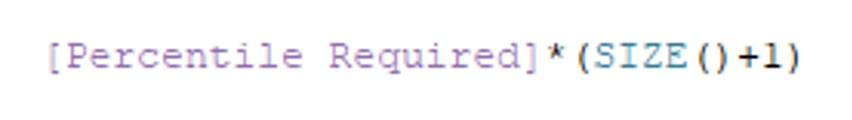
Note: In the attached workbook, the calculation in this step is named [EXC – 1 – Percentile Index]
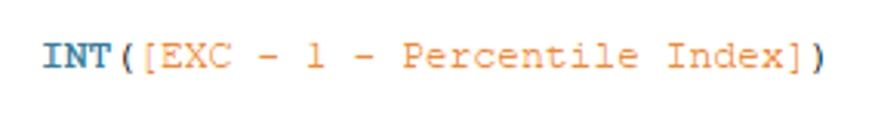
Step 2. Finding the Lower Rank
Again, this is a very simple step as all it requires is to take the integer part of the Percentile Index. Tableau has a standard function for this:
Step 3. Find the Metric Value for the Lower Rank
This is where things start to step up in the calculations.
To put this step into words, we need to find the value from our list of numbers where, if the numbers were ranked from smallest to largest, the rank would match the number we calculated in Step 2. Here is the Tableau TC used to do this:
![]()
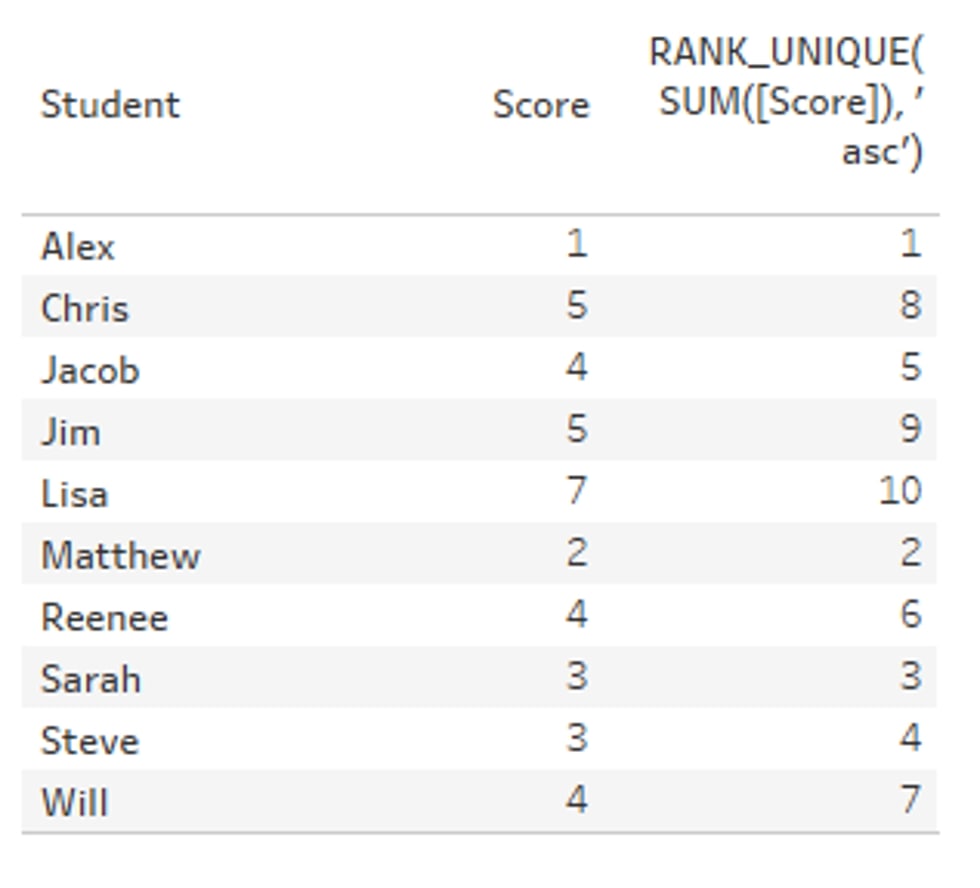
The RANK_UNIQUE(expression, [‘asc’ | ‘desc’]) TC will return a rank for every value in the expression in either ascending or descending order. The “unique” part will mean that if items in the list are the same, they will be assigned different rank values.
Below, Jacob and Reenee have the same score but have been given rank values of 5 and 6:
This is inside an IF statement:

If the rank for the current row = the value found in Step 2, return the value for that rank. If it is not equal, return NULL.
Step 4. Find the Metric Value for the Upper Rank
To put this step into words, we need to find the value from our list of numbers where, if the numbers were ranked from smallest to largest, the rank would match the number we calculated in Step 2 plus 1, i.e. the next ranked number. Here is the Tableau TC used to do this:
![]()
This is exactly the same as Step 3 except that we are looking for the LOWER RANK + 1.
Step 5. Finding the Delta Between the Two Ranks
To work out the interpolated value that falls between the two ranks, we need to find the difference between the two ranks first:

A simple calculation. The WINDOW_MAX function is used to return the same value for every row. In Steps 3 and 4, the Lower and Upper values were only found on the rows where the row rank matches the Lower and Upper Rank values (Step 2). The remaining rows were set to NULL.
If WINDOW_MAX was not used, this calculation for Step 5 would not return any values.
Step 6. Percentile Score Final Calculation
This calculation returns the final percentile score where, between our Lower and Upper Ranks, the Percentile Index sits. It will multiply the delta value from Step 5 by the fractional part of the Percentile Index. This is then added to the Lower Rank Value to get the final Percentile Score:

Again, the WINDOW_MAX function is used to return the Lower Rank Value for every row. In the attached workbook, the CALCULATIONS dashboard shows the different calculation types and their effect on the Student Scores data used in the examples above.
Calculations for all four methods have been numbered to show how the final Percentile Score calculation is built up. Of course, all these can be placed into a single calculation, but they are broken out here to show the basic building blocks.
Important Notes
- When using table calculations in Tableau, it is vital that the calculation is made using the correct data, i.e. is the calculation across the table, down the table, using a cell or a specific dimension, etc.?
- For all these calculations, the Compute Using should be set to Table (down). If you add a TC metric to a sheet and you do not see any data, check the Compute Using setting.
- For the calculations to work, a table calculation must have a table to calculate on. Therefore, even if you are wanting to have a single number only, all the dimension values must be in the table. A filter set on the Student dimension in this dataset will limit the table before the TCs can be calculated!
The next section shows ways in which these calculations can be used in a dashboard.
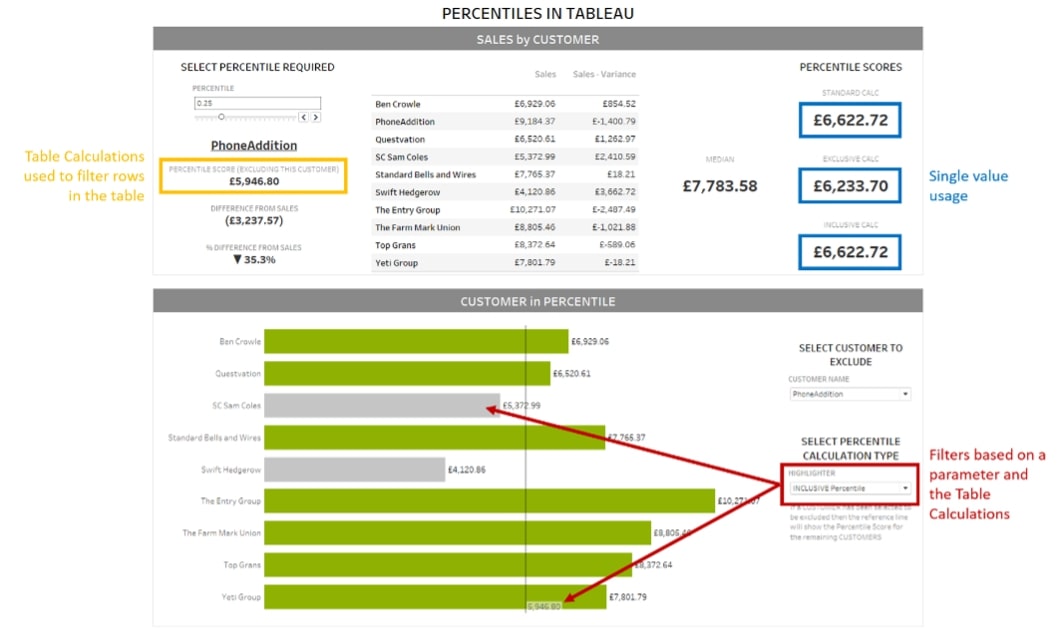
How to Use These Calculations in Dashboards
In the attached workbook, I have included the CUSTOMER SALES dashboard. This dashboard shows how the table calculations outlined above can be used as single numbers on dashboards, as filters and in other calculations:
I hope you found this blog helpful. Be sure to explore the attached Excel file and Tableau workbook, so you can play with the dataset yourself. If there’s any way we at InterWorks can assist you, don’t hesitate to reach out to our team and let us know.
Appendix
Percentile Index calculations for different percentile score calculations: