As always, Tableau delivers on its newest release. There are plenty of great advancements in Tableau 2020.4, but there are two themes that stand out the most to me: maps and SaaS upgrades. The days are quickly approaching where you’ll feel like one of the grandparents in Charlie and the Chocolate Factory and say, “I remember the days when Tableau was an application on my local machine! And I used to carry those extra GBs on my hard drive for 20 miles to work, uphill both ways!”.
Tableau Prep in the Browser
Not to worry—having Prep Builder and Desktop on your machine is likely not going away anytime soon. But there have been some HUGE strides made in this most recent release. First and foremost: Tableau Prep Builder is now available in your favorite browser! This has some monumental advantages. This can help guarantee all your Prep users are using the same version across your organization. It also gives you access to your flows no matter where you are or what machine you’re working on (so long as you have internet access).
Web Editing improvements
In addition to Prep Builder being available in browser, Tableau also stepped up its web-editing capabilities. You can now create extracts from the browser. Your ability to add and adjust vizzes has been improved as well. You can now apply filters to worksheets in the browser, as well as call add-highlight actions in web authoring. Finally, you can now adjust mark labels and create fixed sets with a Creator or Explorer license.
Mapping and Spatial Data
GIS fans might want to sit down for this one… Have you had to hold back on maps due to strict internet access requirements not allowing you to connect to Mapbox, Tableau’s mapping partner? Fear not; offline map support is now available for Tableau Server! But wait, there’s more! Tableau now allows you to connect to spatial data in Redshift. But do you still need to make some adjustments to that spatial data? Or any other spatial data? Well, do I have news for you! Tableau Prep Builder can now handle your spatial data needs! So go ahead … add those special, unique maps to your data!
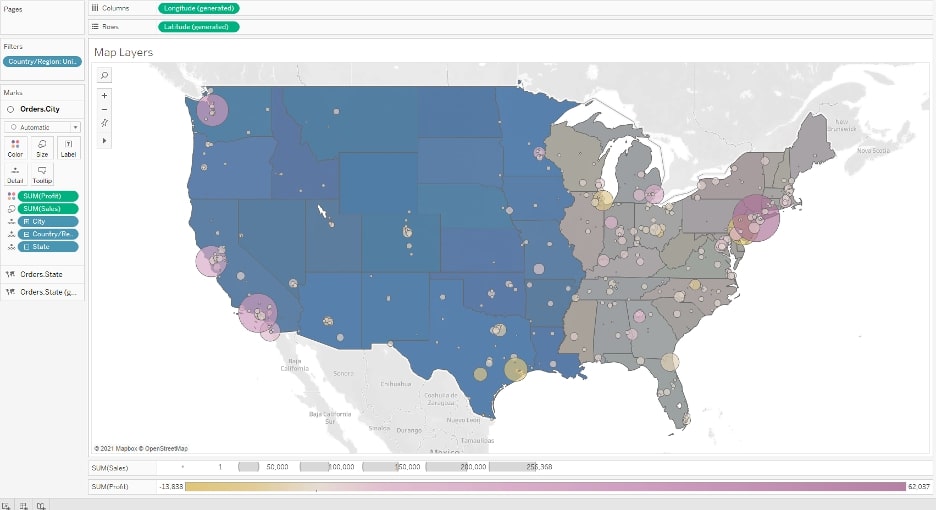
With this monumental expansion to Tableau’s ability to handle spatial data, they further gifted us with a new way to display that data. You can now have multiple mark layers for maps! No more dual axis on longitude and latitude! Now limit to just two map layers! With these newfound superpowers, I must give two warnings, both in the form of quotes from two of my favorite superhero movies: Spiderman and The Incredibles: 1) “With great power comes great responsibility.” Just because you can add multiple layers doesn’t always mean you should, because 2) “When everyone’s super, no one will be.” If you add everything you can to one viz, the insights may become overwhelming, and the user won’t be able to sift through all the information:

Data Science, Comments, Connection and More
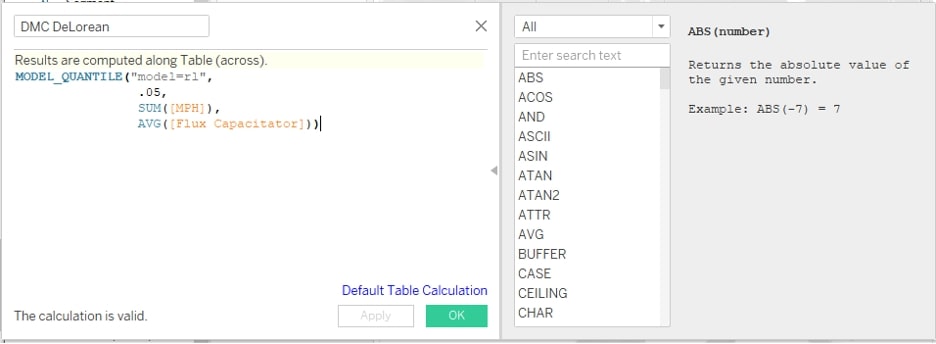
Predictive modeling is always a tricky challenge, as predicting the future often is. Luckily, 2020.4 helps us take a step in the right direction. With the addition of the regularized linear regression (model = “rl”) and the Gaussian process regression (model=gp) functions, you have more control in your predictive calculation in Tableau. Tableau has also added the “Date Axis Extension,” which can be pivotal in showing future values that might not yet be in your data. This is available not only for predictive functions but also for Tableau calculations like running average:

Next, those more familiar with coding can rejoice: Tableau has added block comments to calculations! Now, you can feel at home in how you explain all your brilliant calculations to others. And finally, Tableau continues to make connecting to data easier. There have been improvements made to Snowflake Oauth connections. We’ve also been gifted with the Salesforce Datorama connector and an update to the Salesforce Connector API.
I hope this brief overview was helpful when considering the latest Tableau release. We’re very excited to start utilizing these new features and can’t wait to see what Tableau does next!

