
Devs on Stage is probably my favorite keynote every Tableau Conference. With the move to virtual, it was reimagined to be Devs at Desks. We were invited into these developer and product manager homes to see what they have been working on for the future of Tableau products. This blog is a summary of what was shown.
Predictive Functions and Menu Adds
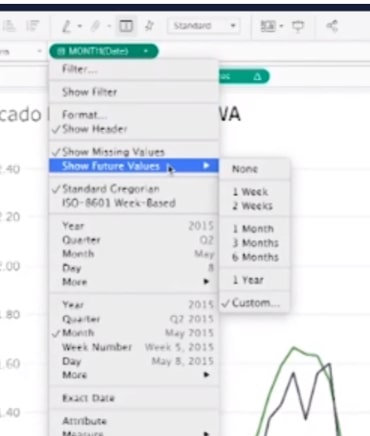
Forecasting has been a feature for a while now, but some predictive functionality required a separate server to work. With the addition of some predictive functions, a separate server will not be needed anymore. How extensive or which exact functions there will be overall wasn’t stated, but it looks to be an add next year. They also highlighted a new menu for Show Future Values where, when using these predictive functions, you can extend the axis:
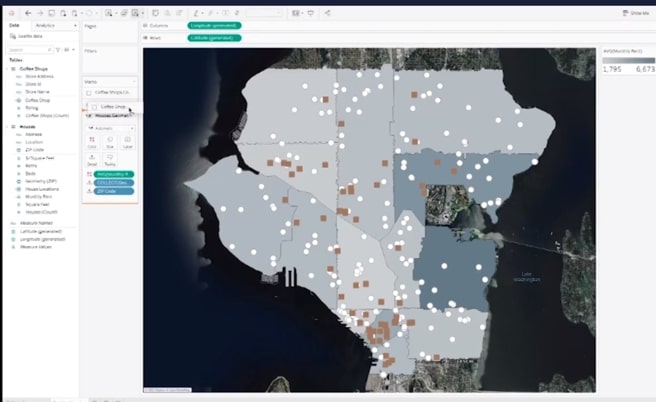
Multiple Map Layers
This feature is an exciting addition. Being able to use multiple geometries to customize maps is a great add. Each layer is represented by a Marks card. Re-order these to place the layers in the order you desire. Pretty slick demo, and nice to maybe get away from dual-axis mapping and have a truly mapping-centric operation as with most mapping tools:
Easy LODs That Tableau Writes for You
Introducing easy LODs. Tableau demo’d functionality where you could highlight the dimensions and measure desired and, with a simple right-click, create an LOD that Tableau will write for you with the new LOD Calculation menu:
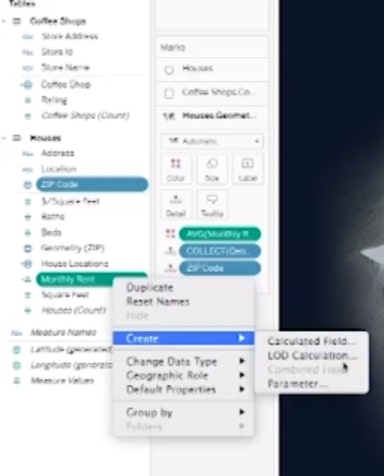
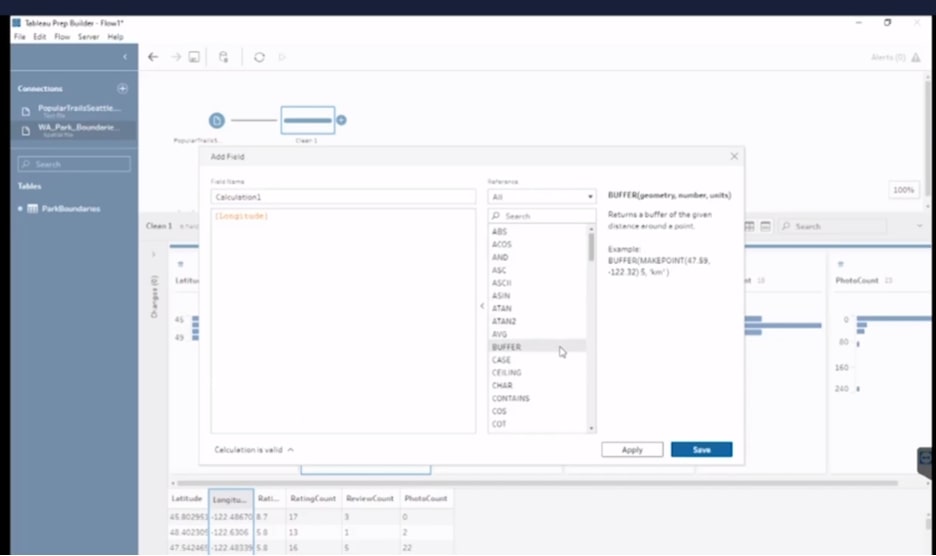
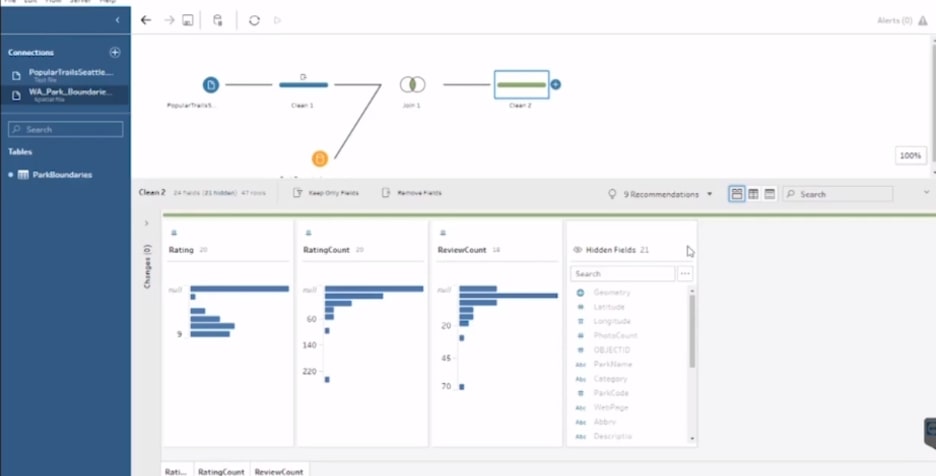
Tableau Prep Updates
Spatial calculations are now added to Tableau Prep, along with the ability to hide fields without filtering them:
Hiding allows Prep to focus only on the columns you care about. Our thoughts go to speed increases here:
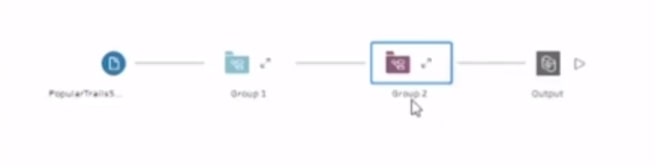
They also introduced a new Grouping Step within Prep:
Ask Data 2.0
Ask Data is getting a complete overhaul. It seems that Tableau has dubbed it Ask Data 2.0. You can now rewrite, update and search by words was highlighted in the demo. They also highlighted being able to train Ask Data, as it now will give active feedback about what it’s using to generate your choices with language processing:
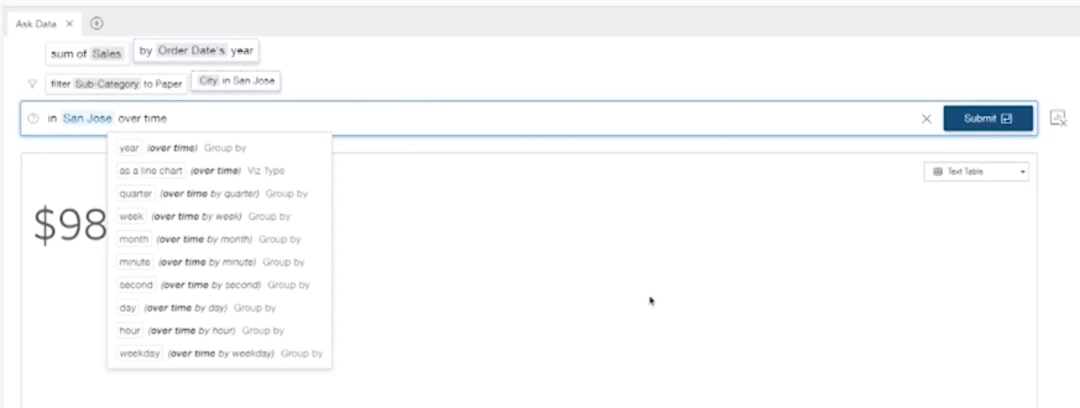
Only what’s highlighted is being used. In the demo, the presenter used a term that wasn’t listed as such in his data. Training Ask Data to know what that term equated to in the data made those options available going forward:
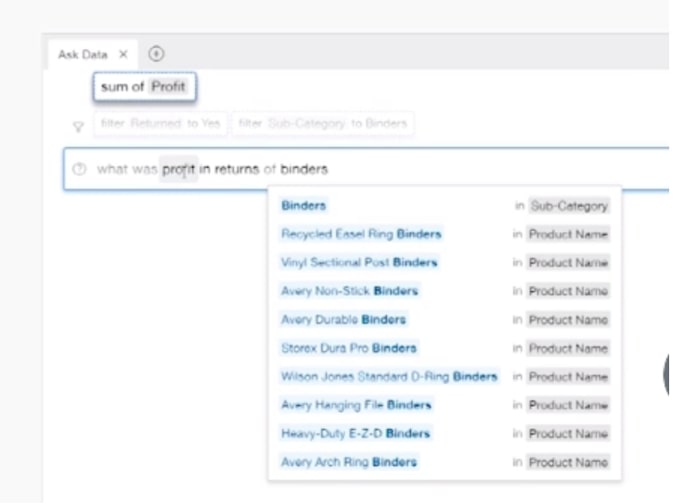
Tableau Server Updates
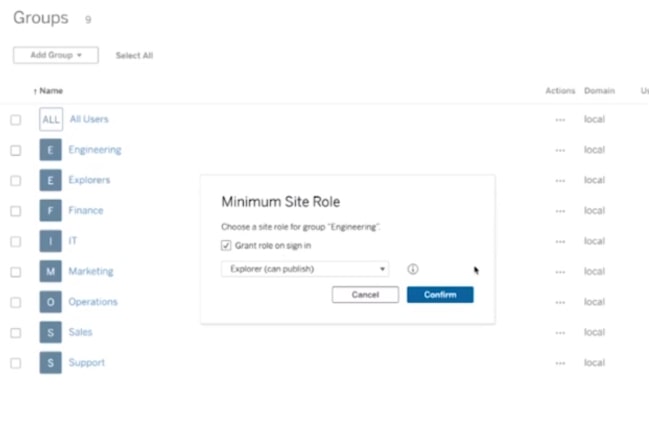
With an emphasis on the checkbox here, Grant role on sign in now has its place on Tableau Server:
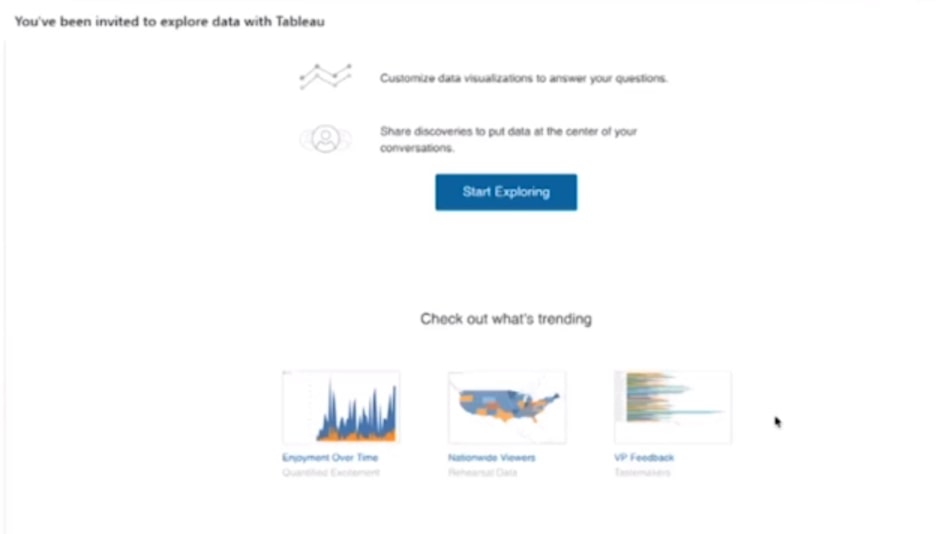
When someone is invited to have access to the Tableau Server, machine-learning improvements now send customized invite emails tailored with content that is active and trending for that user’s assigned groups. User Experience seems to be the trend with these server demos:
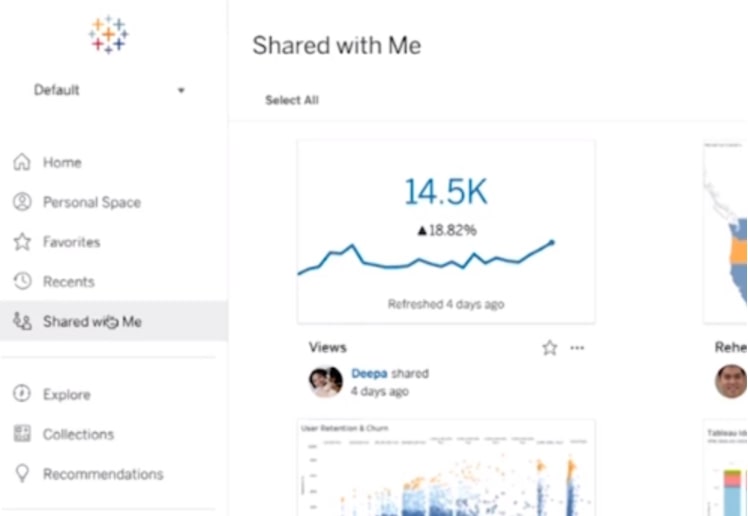
Next was a new page on Tableau Server called Shared With Me. Here, you can find any content that has been shared with you. This way, you don’t have to search back though email, Slack, Teams, etc. trying to find the link that was shared:
Another Server update demo’d was a new Custom Views tab within each workbook. Here, you’ll be able to see what others have customized and what they’ve found important. Maybe it’s just a filter for user, or maybe it’s something you’ve overlooked that users find important enough to customize their own starting page for that view:
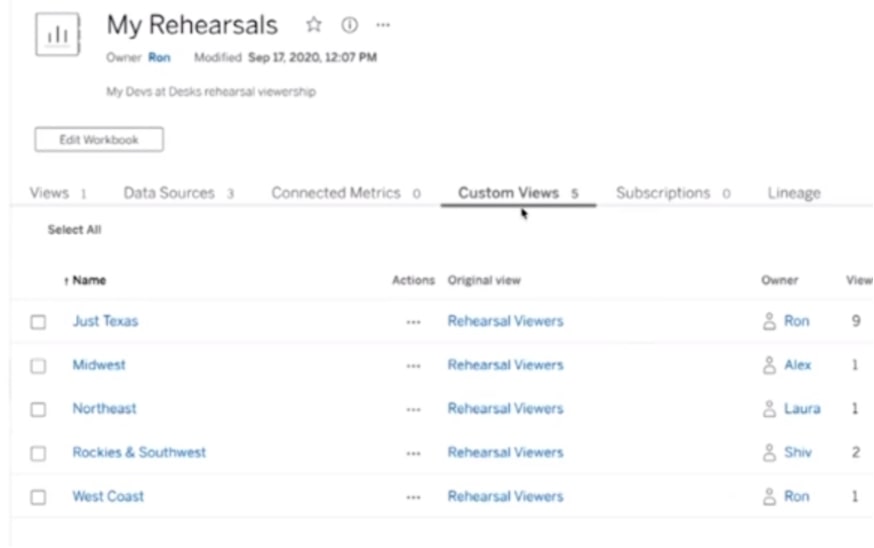
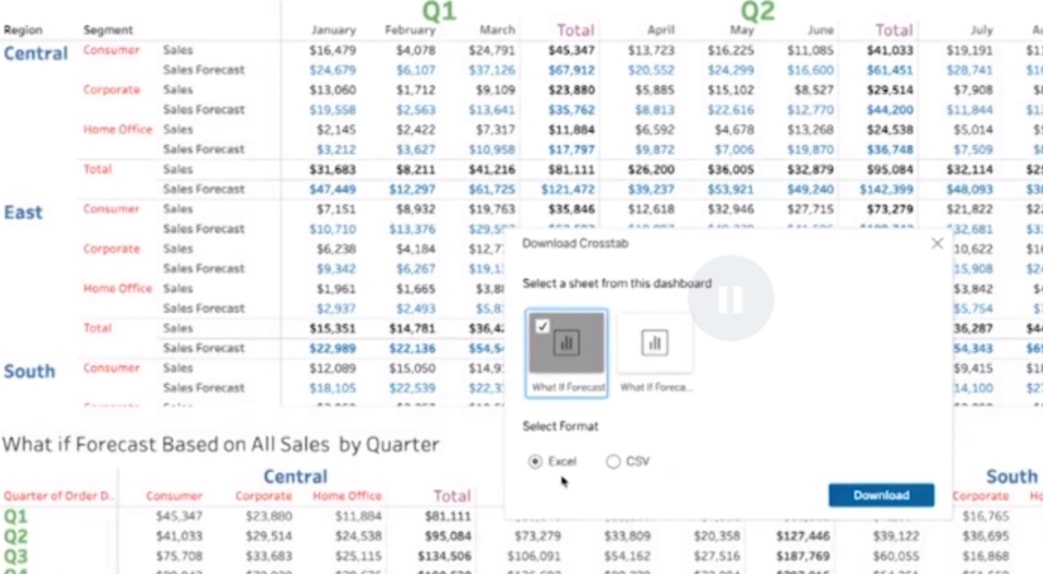
Tableau introduced a new Excel export option that will help in keeping your exports formatted rather than the reformatting that takes place with a CSV export now:
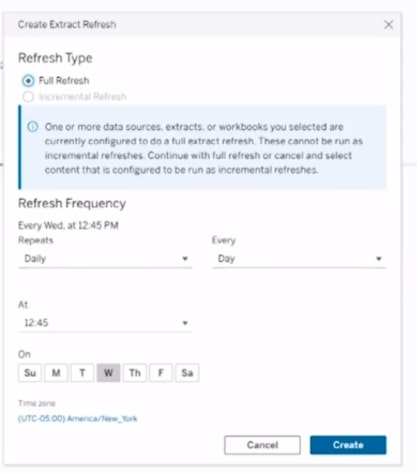
The next update to be demo’d was Custom Extract Schedules. Users know when they need a schedule, and when this feature is enabled, custom refresh schedules can allow the users to create what they need:
Next up was a Stale Content view for Administrators. Stale is defined by you as you see what is being used or what is just taking up space:
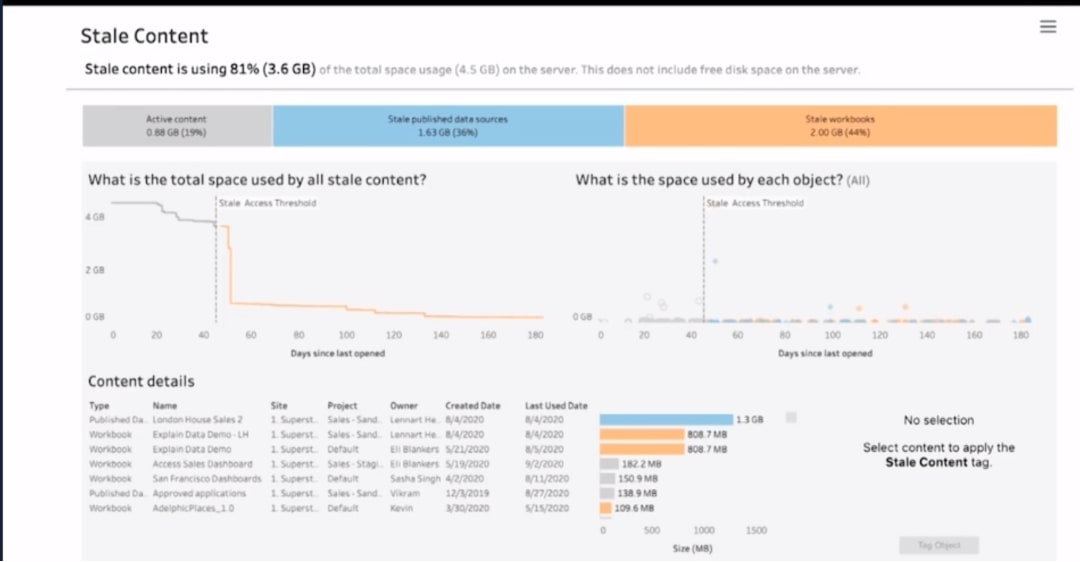
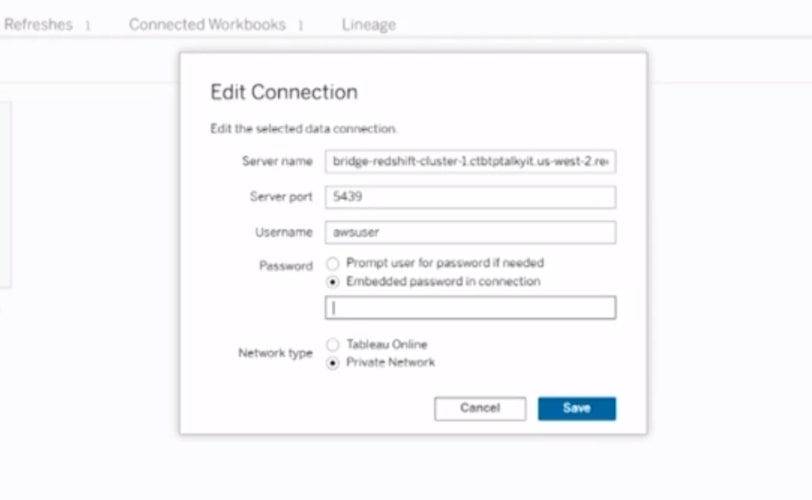
Tableau Bridge Updates
Related to Server, Bridge had some updates to demo this year with the introduction of Private Networks as an option for your connection:
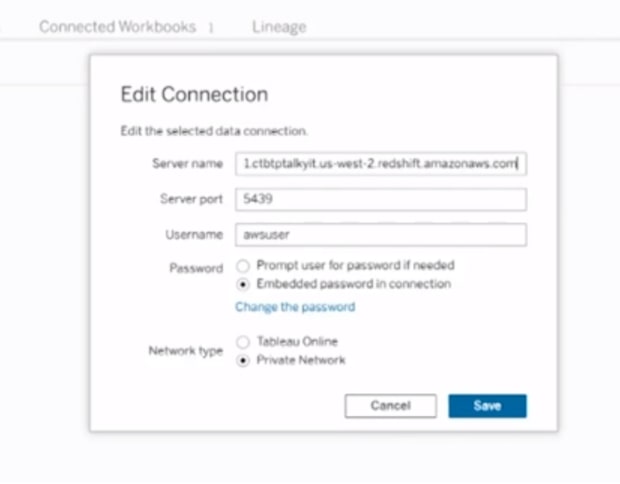
The second update to Bridge was the ability to edit the connection within web, making Bridge far easier to use across an organization:
There’s so much more across all the different sessions at the conference, so be on the lookout for more blogs. This was just a 30-minute jam-packed segment. Looking forward to seeing what else Tableau reveals in the future!