If you’ve been using Tableau for a while, you have probably used parameters and case statements to swap metrics or dimensions. (If this technique is unfamiliar to you, you can read about the basics here.) With the release of parameter actions in version 2019.2, Tableau unlocked some ways to customize the user experience when using this technique.
I wrote a two-part blog series last summer, detailing how I used parameter actions to improve traditional sheet-swapping. Part one is fairly straightforward, but part two gets a little more complicated. I’ve been meaning to write an update for a while, and a recent project gave me the chance to simplify things. Although the use case is slightly different here, the underlying principle is the same: allow users to adjust settings with just one click.
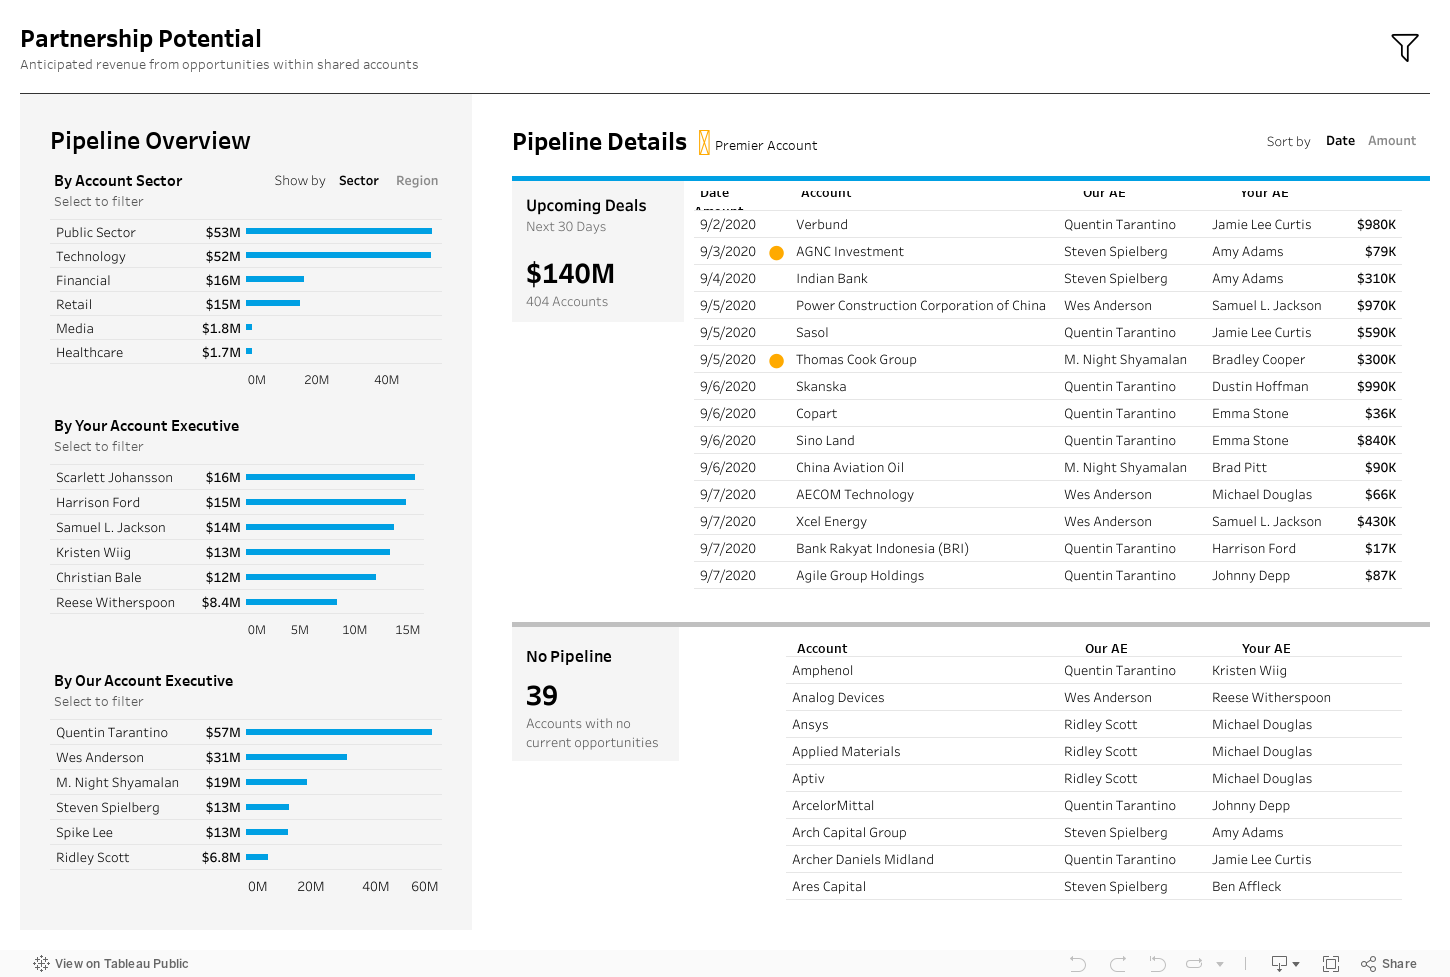
For this project, I knew the audience would want to segment and sort the data in various ways, so I built in a few ways to customize the view using parameter actions, which you can see below:
I’ll walk through the steps I followed below, but you can also skip to the bottom and download the workbook if you want to reverse engineer it.
Step 1: Create Your Parameter
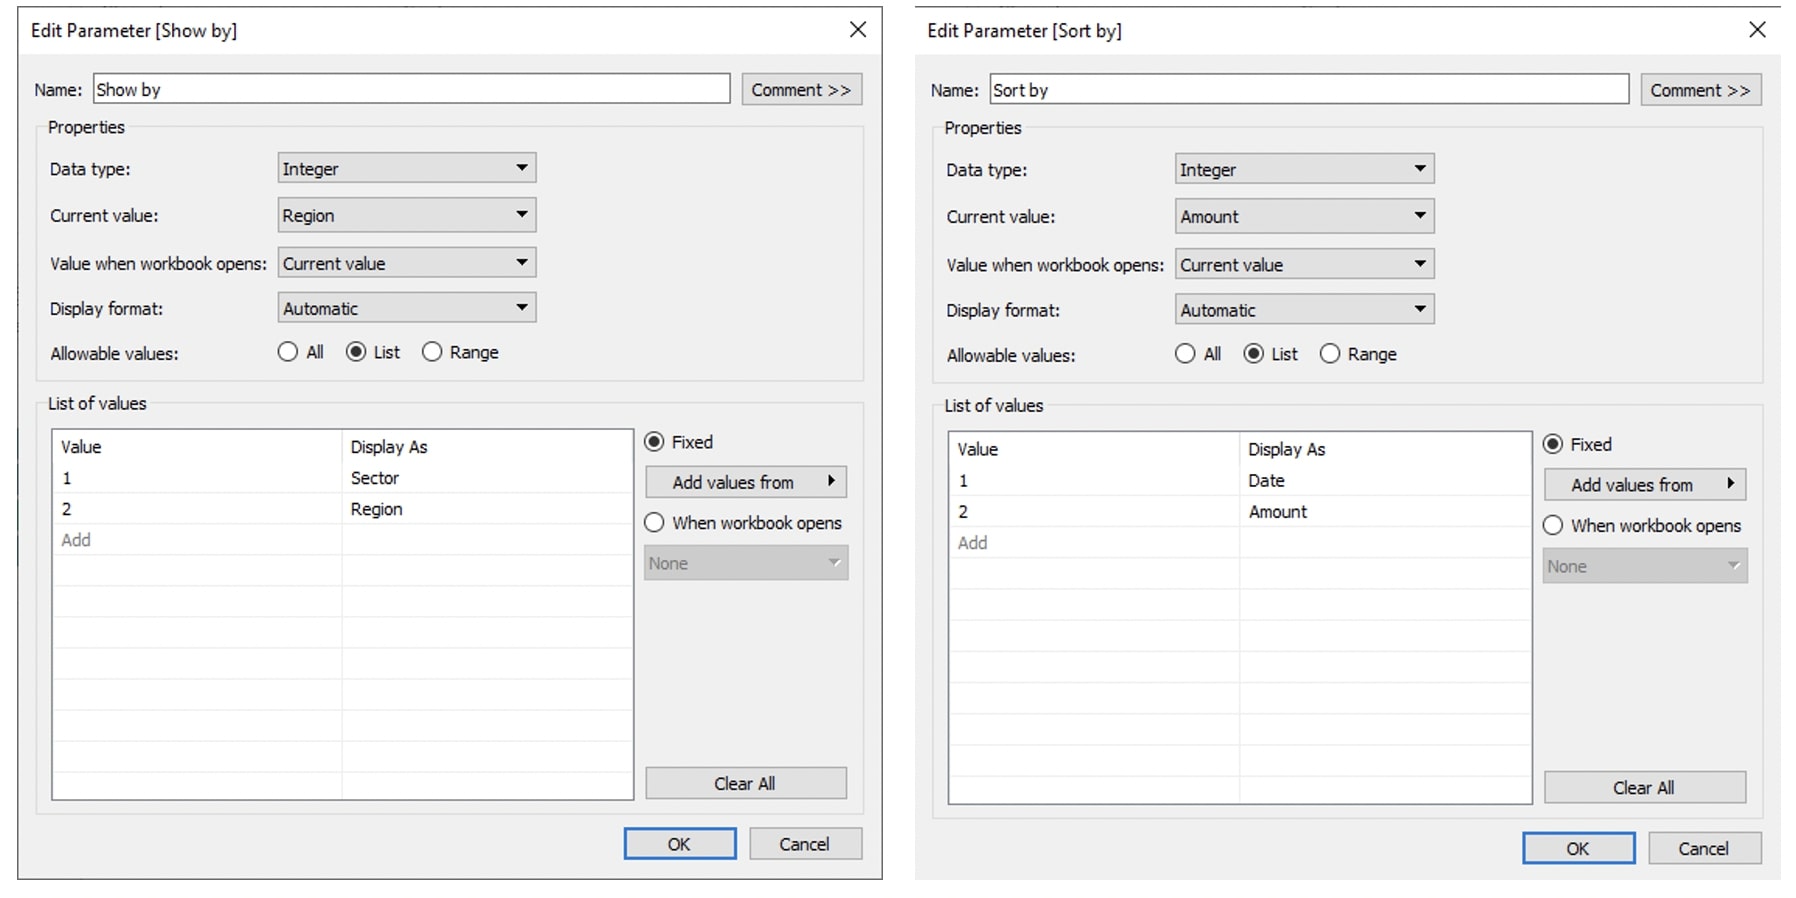
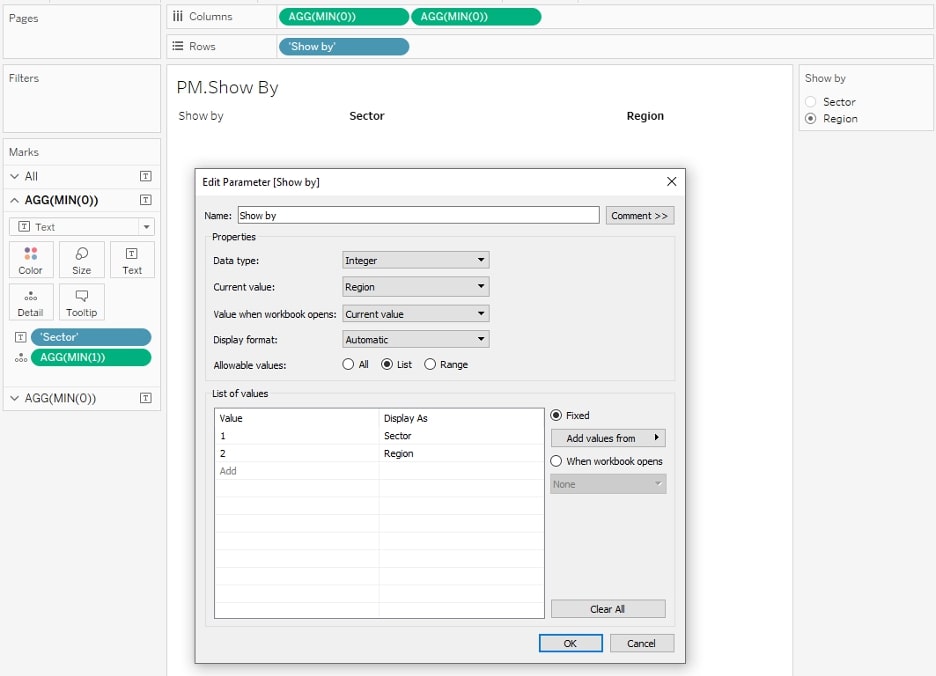
I created two parameters for this project – a Show By and Sort By parameter. The Show By parameter controls how the top bar chart is segmented: by region or by sector. The Sort By parameter controls how the list of details is sorted: by date or by amount. Since the technique is basically the same for both, I’ll focus on the Show By parameter for the rest of this article, but both parameters are set up as integers with two options (you can definitely add more if you need to):
Step 2: Create Your Case Statement
By writing a case statement connected to the parameter I just created, I can specify the conditions that result from my parameter selection:
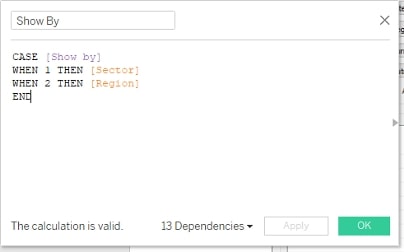
When the parameter equals one, Tableau references the Sector field. When the parameter equals two, Tableau references the Region field. With that field on Rows, interacting with the parameter now controls whether my data is segmented by Region or by Sector:
Step 3: Create a Sheet That Will Control Your Parameter
You could easily display that parameter and call it a day. But you would be limited to displaying the parameter control as a drop-down list or radio buttons. I mentioned that parameter actions open up some options for customizing the UX here, particularly the alignment and formatting of our parameter control. Before we get to the parameter action, we first need to set up a sheet that will serve as the source of the action.
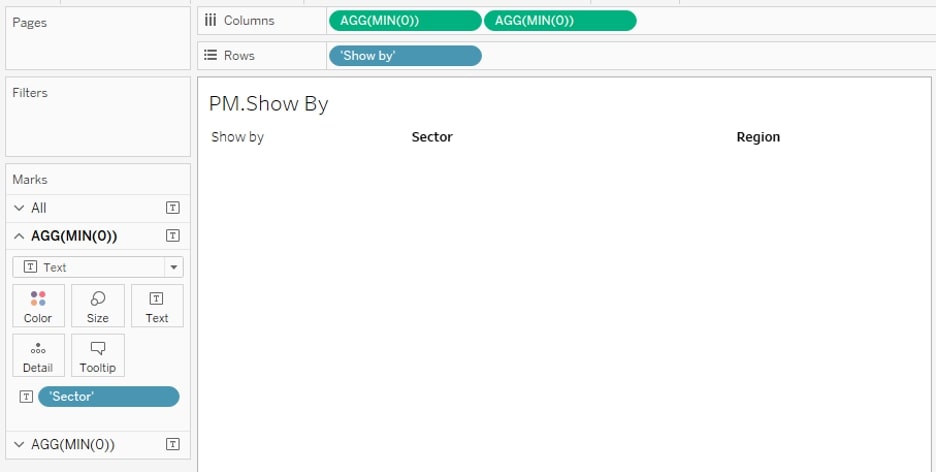
I created this sheet using all ad hoc calculations, so get ready for some double-clicking. First, I double-clicked in the Columns shelf and typed MIN(0) to create an axis. I repeated that to create a second axis. Then I double-clicked in the Rows shelf and typed Show by to create a header. On one of my Marks cards, I double-clicked and typed Sector, then moved the field from Detail to Label. Then I repeated that on the other Marks card with Region. So the final product looks like this:
Step 4: Set up Your Parameter Action
In order to control my parameter without displaying it, I needed a way to pass the values 1 and 2 to my parameter. Since Sector is equal to the value 1 in my parameter, I needed the value 1 on Detail on my Sector Marks card. I just double-clicked in the Marks card again and typed MIN(1). Then I repeated that with MIN(2) on the Region Marks card:
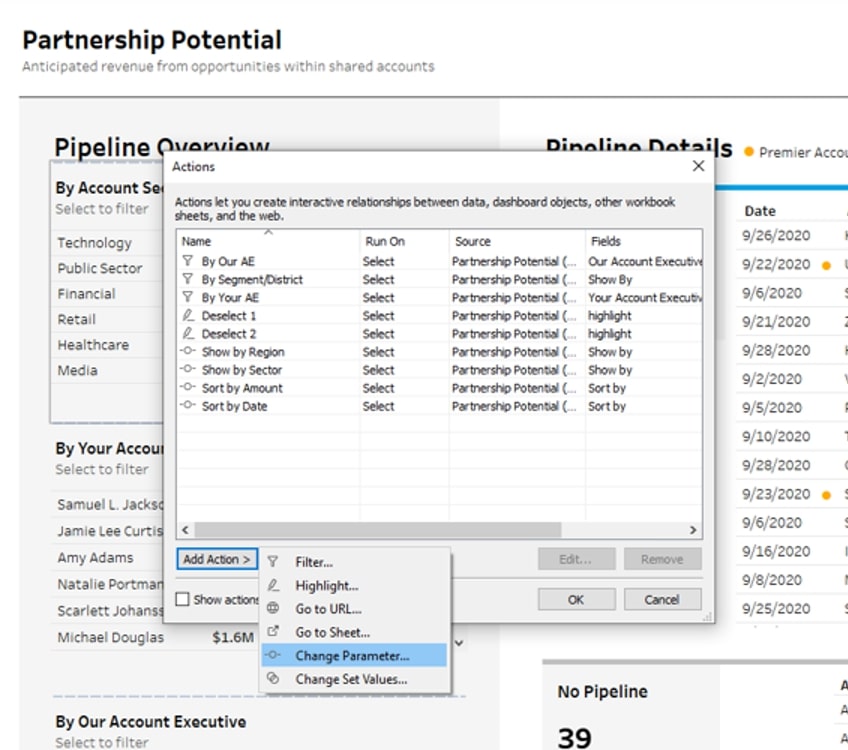
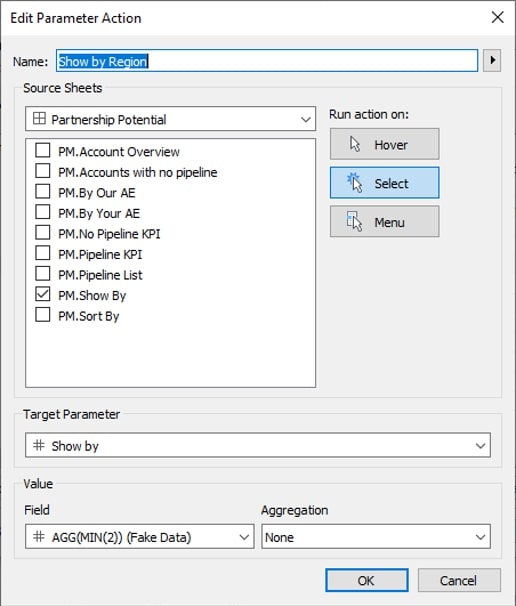
Once I added that sheet to my dashboard, I could connect it to a parameter action (Dashboard > Actions > Change Parameter):
To show my data by Sector, I just needed to run an action on Select from the Show By sheet I built. I targeted the Show By parameter I set up in step 1 with the field MIN(1) that I placed on Detail. I chose no aggregation to preserve the value 1 even if there were multiple records to aggregate:

To show my data by Region, I just repeated these same steps, setting up another parameter action that targeted my parameter with the value MIN(2) – again, with no aggregation:
Now, simply clicking on the words Sector or Region controls how my data is segmented. In the GIF below, I’ve shown the traditional parameter control as radio buttons at the top, but I no longer need to display this control since users can interact with the parameter directly through the sheet I set up:
Things are looking pretty good, but steps 5 and 6 will help our UX feel very clean and intuitive.
Step 5: Add Color to Reinforce the Active Selection
To reinforce the user’s active selection, I added a field to Color on my Show By sheet. It’s just another set of ad hoc calculations. I double-clicked on my Sector Marks card and typed [Show by]=1. That will produce a Boolean (T/F) field, which will be true when my parameter is set to Sector (value = 1) and false when my parameter is set to Region (value = 2). I did the same thing on my Region Marks card, except my ad hoc calculation was [Show by]=2. By adding this ad hoc calculation to Color, I could choose a black color for the true condition and a lighter gray color for the false condition. Now the color of my text reinforces which option is actively selected:
Step 6: Remove Highlighting … Sort of
That pesky yellow highlighting kind of bothers me because I’m a little OCD:
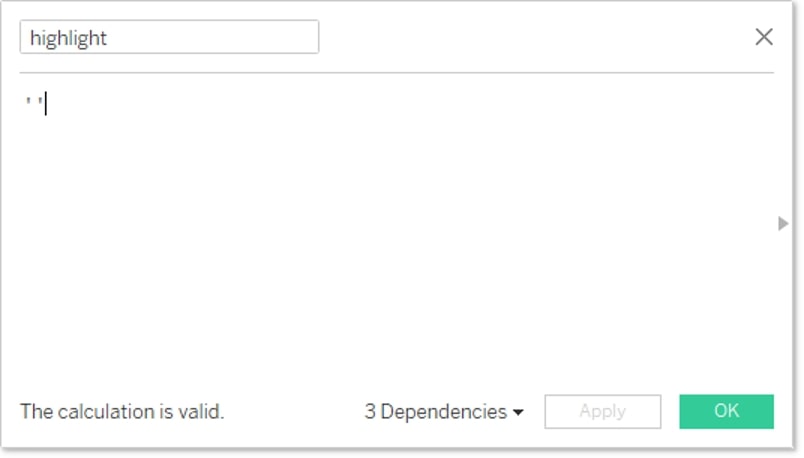
This trick from Brian Moore has become one of my favorite tips for auto-deselecting and removing highlighting. Unfortunately, it only partially works here without a few additional steps. But here’s the basic technique: I created a blank calculated field (this one actually has to be a calculated field, not just an ad hoc calculation):
Then I added that field to Detail on my Show By sheet. Then I set up a simple highlight action, using that field:
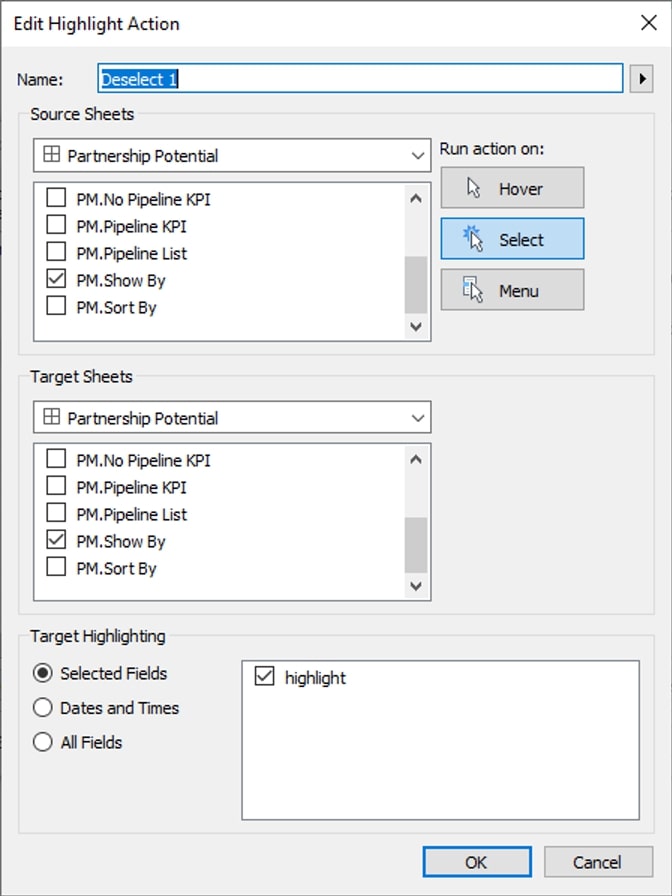
This technique should immediately deselect anything you click on. Unfortunately, it doesn’t work quite as well with a text mark type as other mark types, so the highlighting behind the Region and Sector text remains, but at least the yellow highlighting on the header is gone:
To get rid of that highlighting behind the Region and Sector text, I had to take three extra steps, which is getting away from the point of this article—to simplify things. But if you really want to know, here’s what I did:
- Changed my mark type to shape and used a transparent PNG
- Created two versions of my Sector label – one that shows only when the parameter equals Sector (I’ll color that one black later) and one that shows only when the parameter equals Region (I’ll color that one gray later)
- Repeated that for the Region label
- Placed those labels on the Marks cards and colored one gray and the other black
Here’s the final result:
Those four extra steps are a lot of work just to get rid of some highlighting, so it looks like I’ve still got room to simplify this further. Feel free to reach out to InterWorks or me on Twitter if you’ve got a good solution! In the meantime, the full dashboard (with the extra steps) is below if you want to download it and copy anything. And if you liked this tip, check out this webinar where I shared a few more modern UX design tips.