
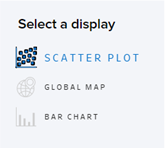
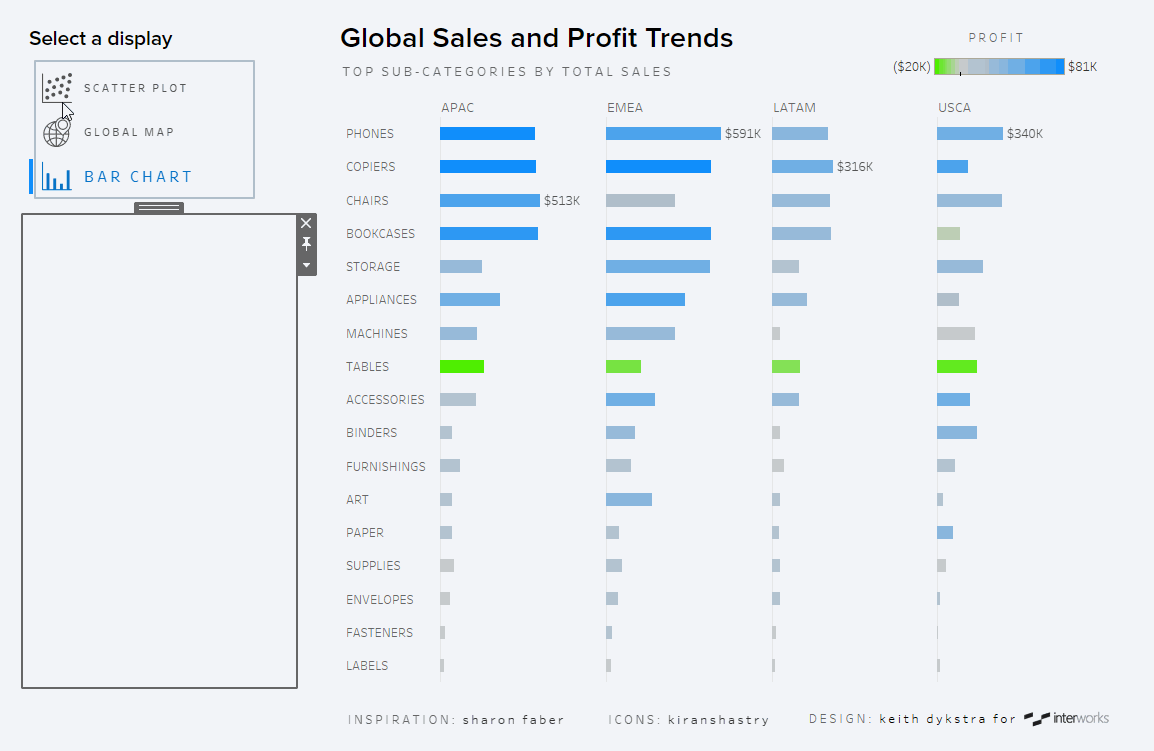
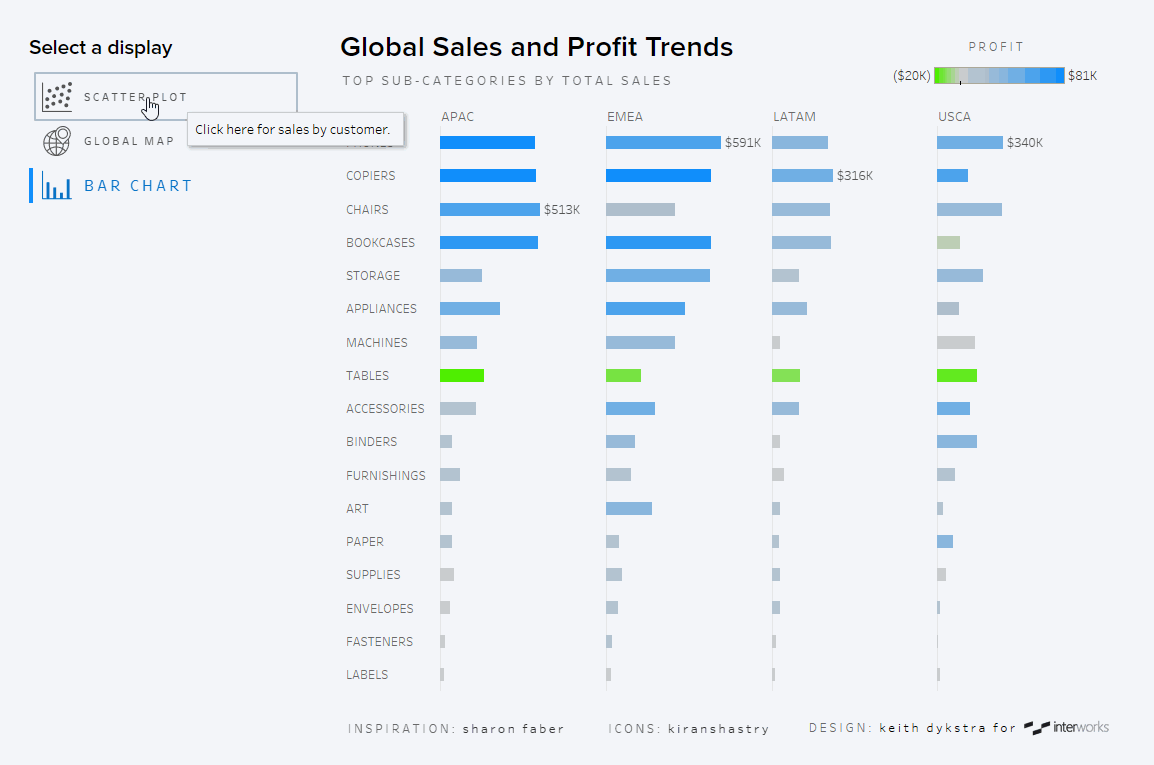
In my last post, I showed you how to replace a traditional drop-down menu with icons to swap sheets using parameter actions. In this post, we’ll take this a step further and refine how the icons look when they’re selected, removing the black border and adding a blue sidebar. Essentially, we’re taking the chart options menu from this:
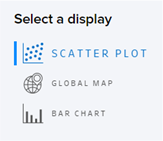
To this:
Let’s start with the blue side bar to emphasize our selection. This is really no more than a sheet with colored squares we’ll later size in a clever way:
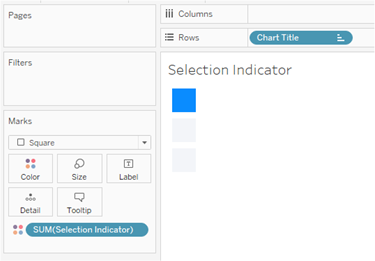
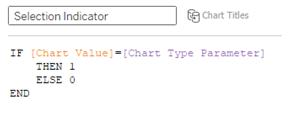
We can’t quite use the same color field that we used in the last post to color our icons and text because we want the un-selected chart’s squares to completely disappear, rather than appear in gray. So, simply duplicate your color field (the same syntax works), give it a different name, and drop that field on color:
For 1, assign the same color you used for your selected chart icon (I’m using blue #0a8cff here). For 0, select the color you’re using for the background of your dashboard so that it will completely blend in. Then format the shading of this sheet to None (to make it transparent) or match it to your dashboard background as well. When you add it to your dashboard, fixing the width around 10 pixels will cut off part of the squares, making them appear as bars instead:
You may need to play around with the sizing a bit to get things lined up correctly, and you’ll want to float a blank box over the scrollbar that appears at the bottom of your sheet. You could also use a rectangular-bar-shaped .png file as your custom shape if you don’t want to mess around with sizing squares that appear like bars.
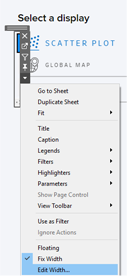
Removing the Default Icon Border in Tableau
Next, we’ll deal with that black outline Tableau adds when you select an icon. In the past, you may have floated a transparent sheet on top of another sheet to prevent users from clicking on something. That’s what we’re going to do here as well. But since clicking on an icon feeds a value to our parameter, which swaps our sheets, we’ll need to make sure the transparent sheet on top can also pass that same value to the parameter. (If you’ve never set up transparent sheets before, there are just three simple steps required.)
At first, I tried to do this with one sheet that had a separate row for each chart type, but trying to make an invisible shape that would cover the icon and text behind it without overlapping the shape in the row below it was pretty difficult. Notice below how the tooltip sometimes indicates a different chart than the one we’re trying to select because the shapes are overlapping:
In addition, right now, the shapes don’t extend all the way to the edge, leaving some blank space where users could click and nothing would happen. But making the shapes even bigger would cause them to overlap even more.
Using Transparent Sheets to Enhance the User Experience
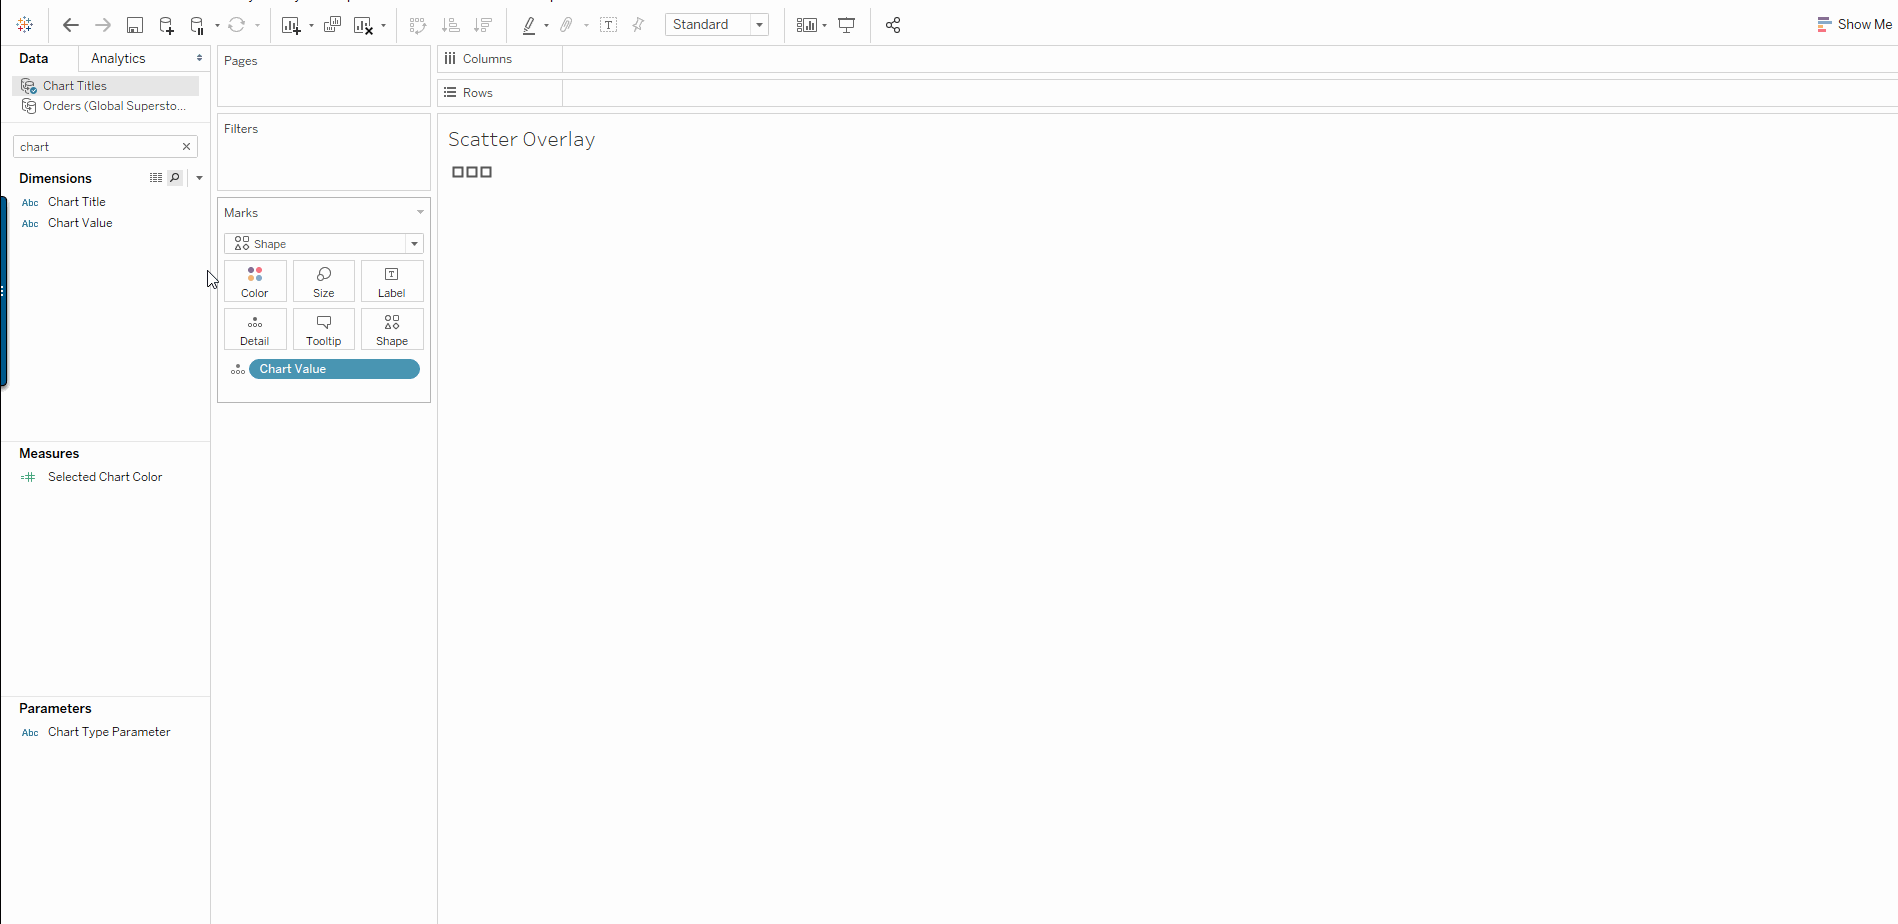
To avoid confusing users and forcing them to hover very precisely to select a chart type, I decided to use a separate transparent sheet to cover each chart type so that I could control the size of each overlay. By filtering down to one chart value, putting that value on Detail, fitting the entire view and then increasing the size of the shape to its maximum value, you can create a shape that covers the entire sheet with borders that extend beyond the sheet. The sheet appears completely blank, but clicking anywhere on the sheet will pass the value of the chart type on Detail to the parameter when we set up our parameter action:
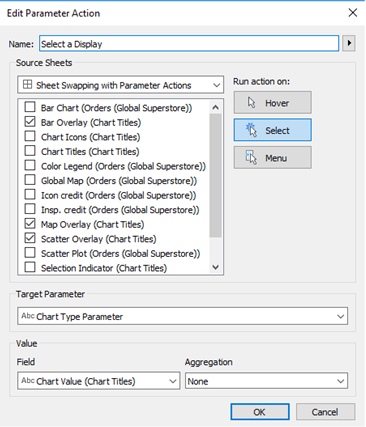
Repeat that process to create a blank for each of your other chart types. Float those sheets on your dashboard, adjusting the size to cover one icon without overlapping the icon below it. Then use those sheets as the source for your parameter action:
Now you’ve given users a very intuitive and engaging way to select how they want to see the data:
To interact with the dashboard further, you can find it on Tableau Public. I hope these two posts have been helpful in your exploration of parameter actions in Tableau!