When it comes to ratings in Tableau, you should be able to customize them as much as the platform allows you to customize its other aspects. This process will show how you can tailor your ratings to include half, or even quarter, stars and change the rating shape entirely!
Customize Your Rating System
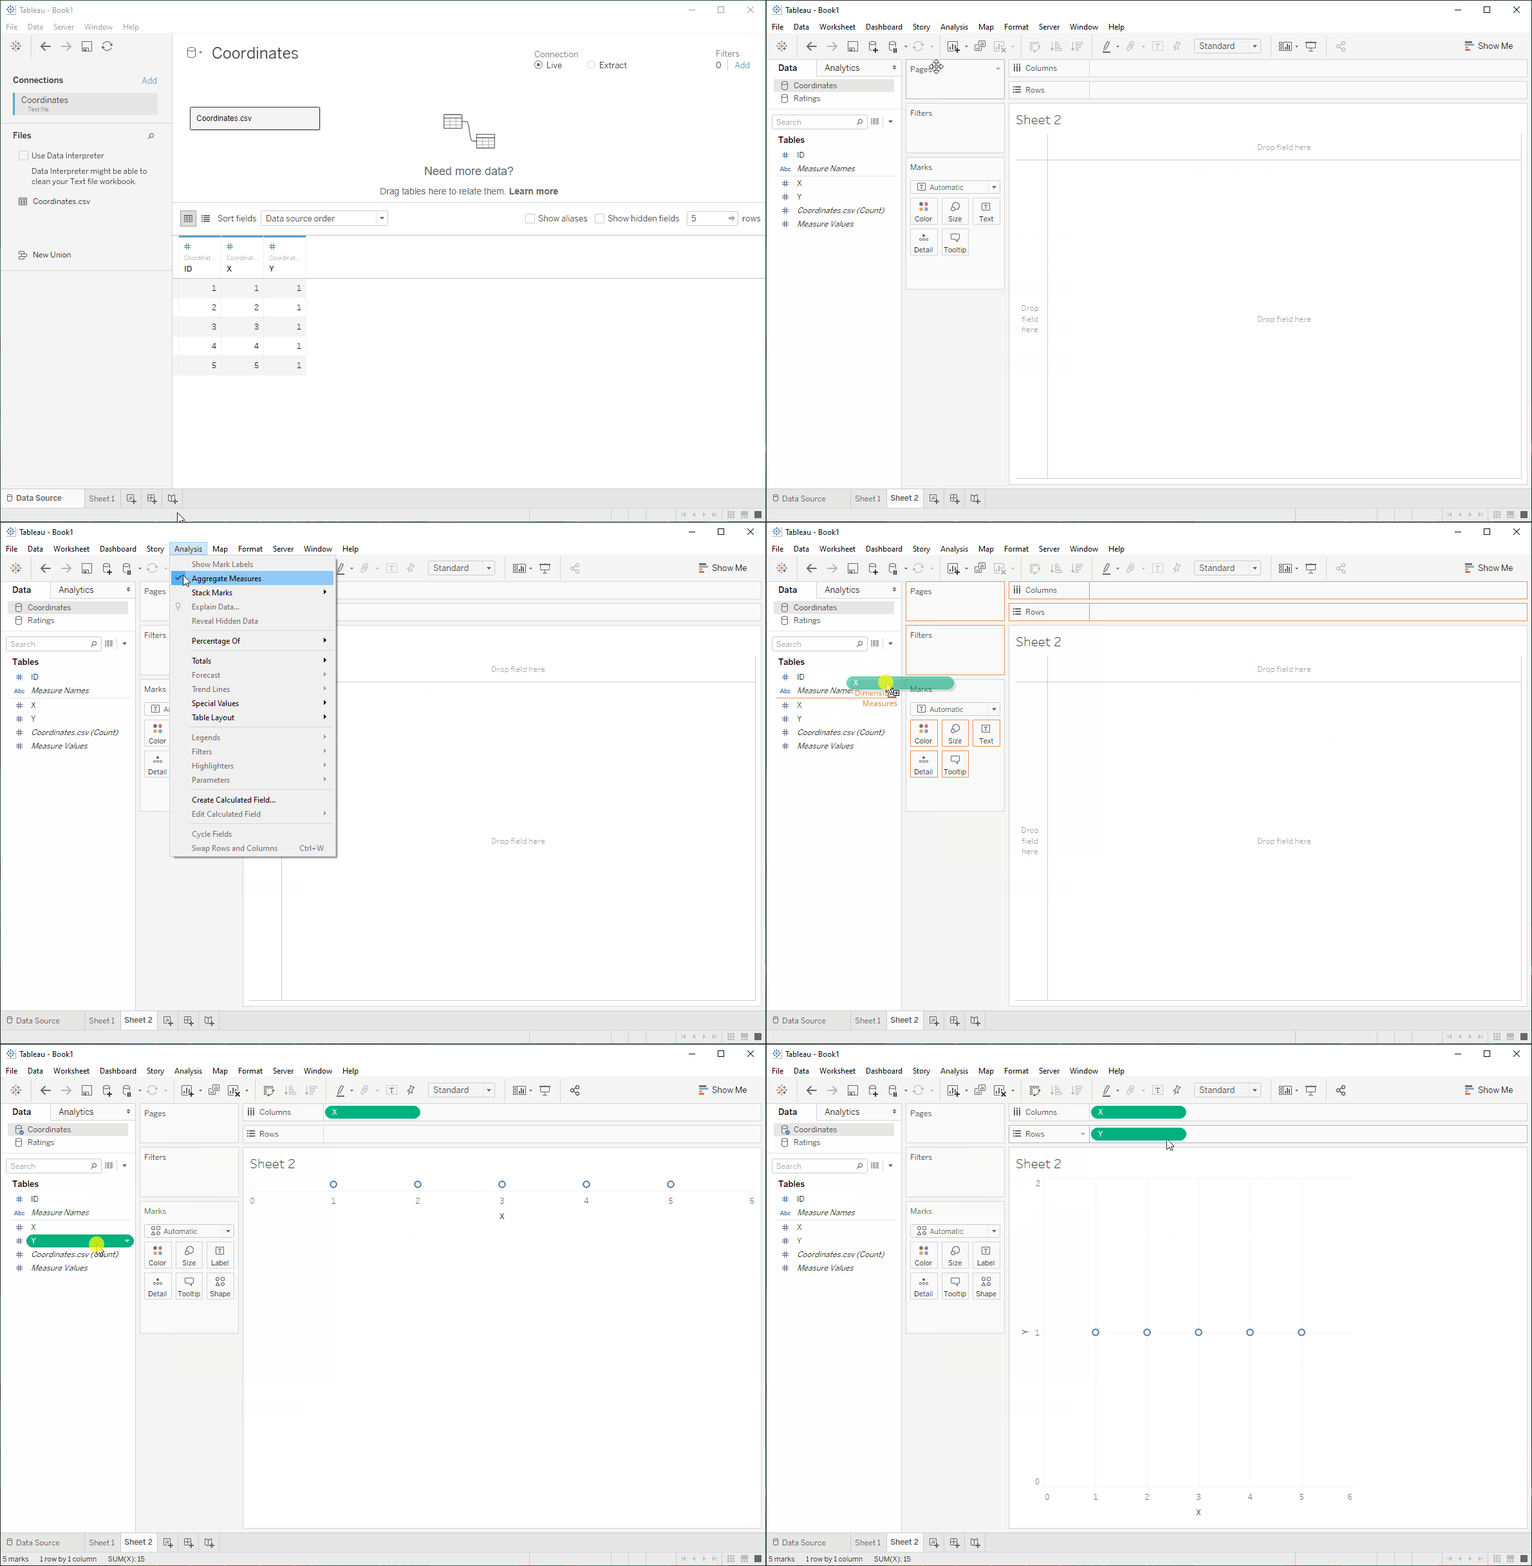
Step 1: Download the CSV file (found at the bottom of this post), and add it as a new data source in Tableau.
Step 2: Create a new sheet, click on Analysis, put X on Columns and Y on Rows:

Step 3: Download the star tiles attached at the bottom of this post (or use your own – could be wine glasses, plates, phones, whatever you like), and paste them into the folder MyTableauRepository (inside your Documents folder).
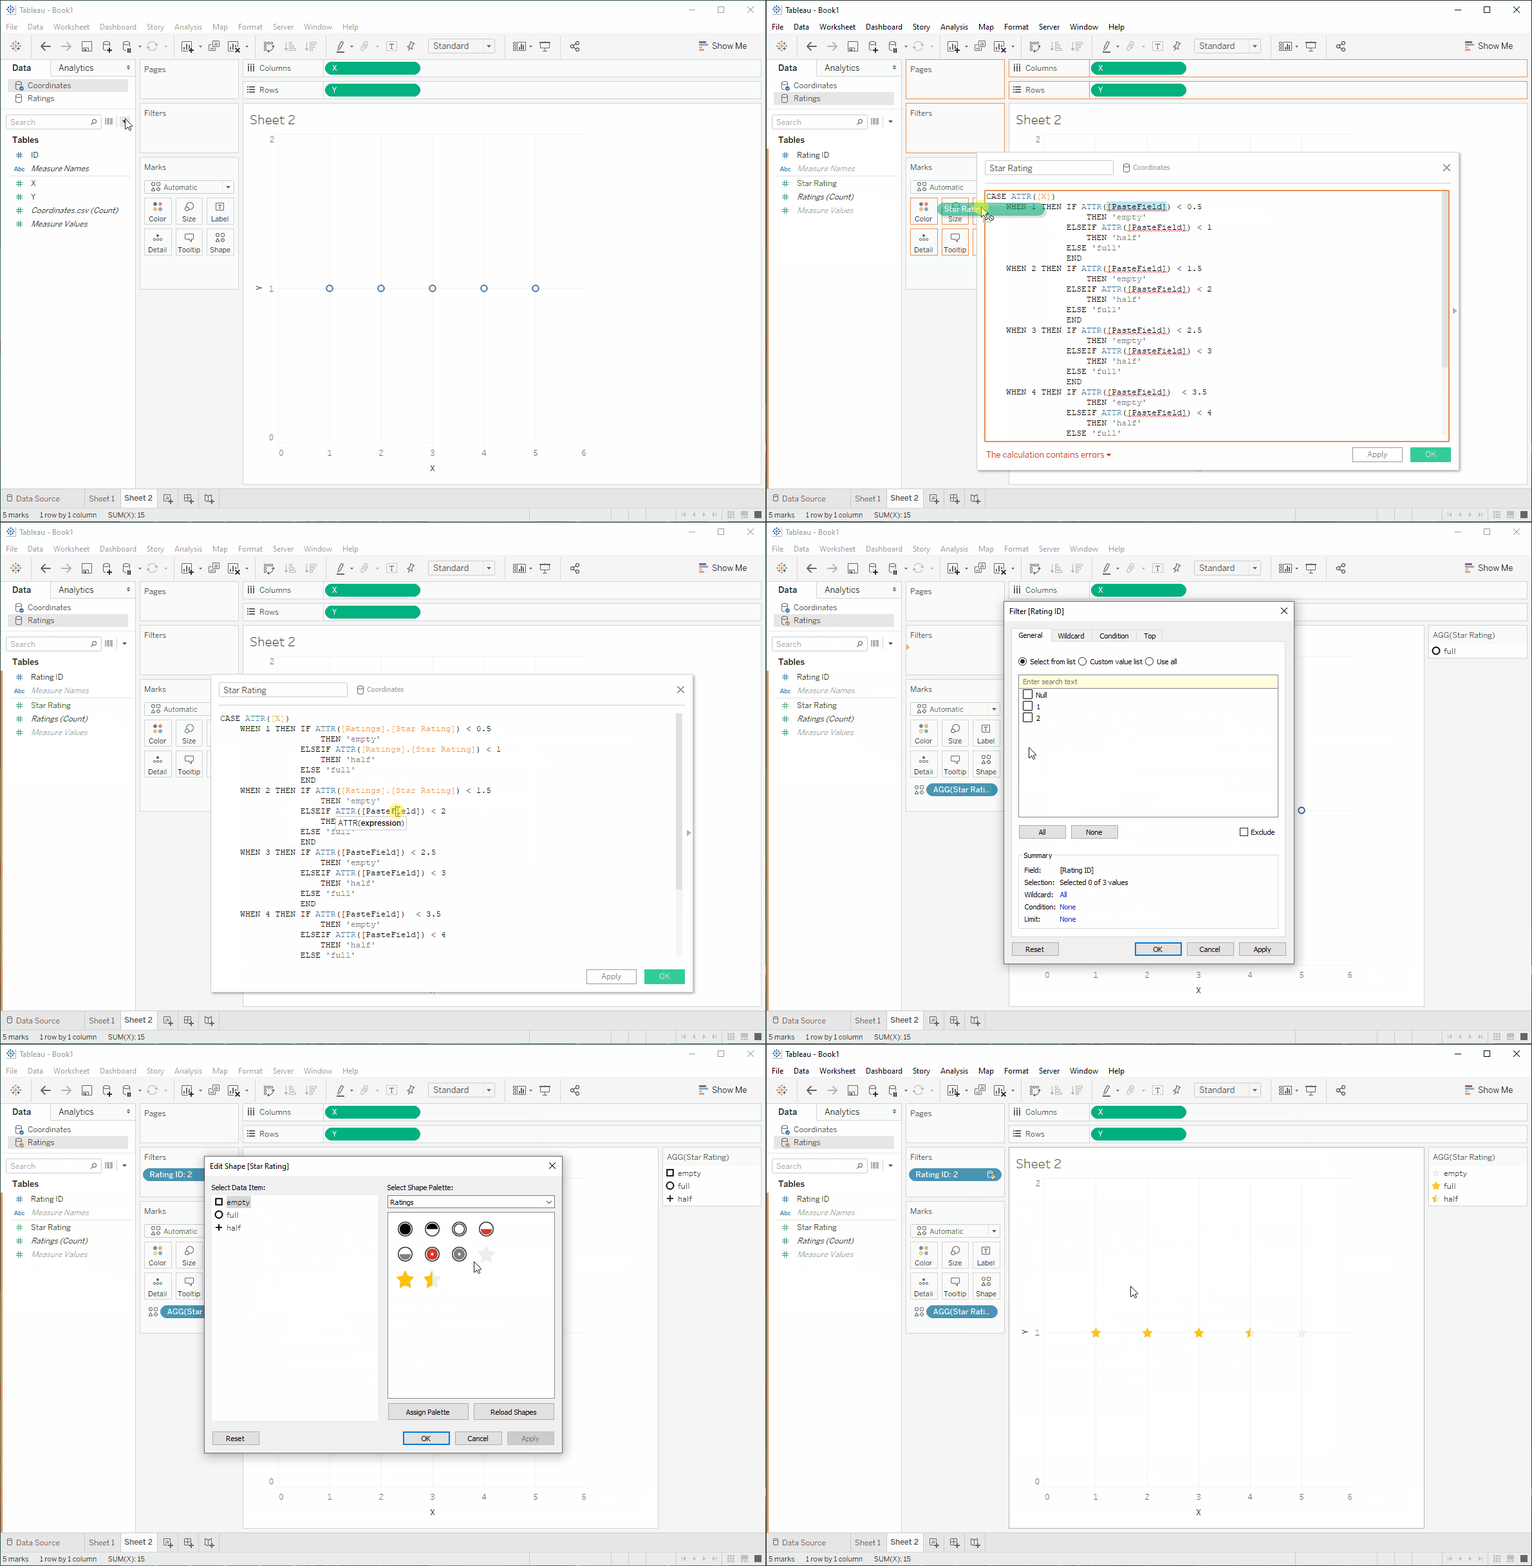
Step 4: Paste the following calculation into a new calculated field:
CASE ATTR([X])
    WHEN 1 THEN IF ATTR([PasteField]) < 0.5
                    THEN 'empty'
                ELSEIF ATTR([PasteField]) < 1
                    THEN 'half'
                ELSE 'full'
                END
    WHEN 2 THEN IF ATTR([PasteField]) < 1.5
                    THEN 'empty'
                ELSEIF ATTR([PasteField]) < 2
                    THEN 'half'
                ELSE 'full'
                END
    WHEN 3 THEN IF ATTR([PasteField]) < 2.5
                    THEN 'empty'
                ELSEIF ATTR([PasteField]) < 3
                    THEN 'half'
                ELSE 'full'
                END
    WHEN 4 THEN IF ATTR([PasteField])  < 3.5
                    THEN 'empty'
                ELSEIF ATTR([PasteField]) < 4
                    THEN 'half'
                ELSE 'full'
                END
    WHEN 5 THEN IF ATTR([PasteField]) < 4.5
                    THEN 'empty'
                ELSEIF ATTR([PasteField]) < 5
                    THEN 'half'
                ELSE 'full'
                END
END
Step 5: Place the calculated field on form, filter for a rating, and adjust the form for each value: empty, half and full. You might want to increase the size of your forms, remove any grid lines or zero lines, and hide row and column headers now.

Tip: If you are struggling with the blend, you can download the Tableau workbook, in which I have included a version that does not use a blend but is slightly more complex to build.
Now, go get your five-star ratings!


