This post builds on my previous blog that laid out the basics of using the new Tableau Prep integration with R. Here, we’ll go a little bit deeper with a more complicated example and another dimension to this new capability.
Using Tableau Prep and R to Add Rank to Your Data
Do you need to add a rank of some sort to your data? Do you have Tableau Prep 2019.3 or later? There are countless instances where having rank hard-coded in your data would make things a lot easier. But how do you do this in Tableau Prep? The only other solution I’ve seen of accomplishing rank in Tableau Prep is the brilliant but convoluted self-join technique (See Josh Mulligan’s article for more on this). To make life much easier, I’ve created an R script you can use in your Tableau Prep workflow to add a rank to your data. This article is broken into two parts:
- How to use this R script to add rank
- How to understand the script so you can try to create your own R functions in Tableau Prep
The “Just Let Me Add Rank” Part
There are a few steps you must follow to get this to work:
- If you haven’t already, set up Rserve for Tableau Prep. If you need some guidance on this, check out my previous article walking through how to do that.
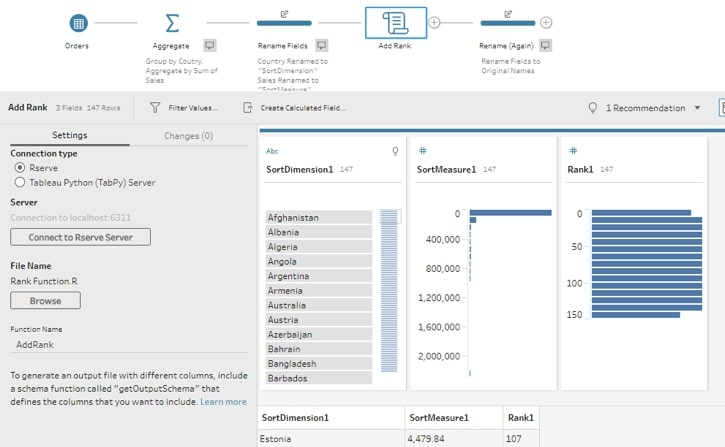
- You need to limit your data source to just two fields (you can join this back to the rest of your data later in the workflow). The incoming data for this script needs to consist of one string field named SortDimension and one numeric field named SortMeasure. The [SortDimension] field should be Unique, so you may need to use a Unique ID field, concatenate fields to make each row unique or aggregate (like I did).
- Set up R Script Step:
- Connection type: Rserve
- Server connected to localhost:6311
- File Name: Rank Function.R
- Function Name: AddRank

With these steps done, you’re now ready to run the script and rename your fields!
Now, on to the nitty gritty.
The “How Do I Write R Scripts for Tableau Prep” Part
I had a hard time finding examples of R scripts for Tableau Prep, so I set out to make my own for others who were hoping to utilize this awesome new feature.
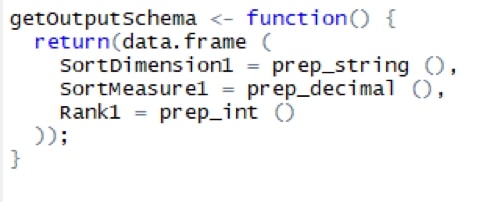
I’ll start by breaking down the script I wrote for AddRank. This file can be broken down into two parts: defining the function and defining the output. I’ll start with defining the output.
For the output, I need to use the getOutputSchema function so that Tableau Prep knows what to expect from R. This function returns a rank, which will be an integer, a measure that will be numeric, and a dimension that should be a string. That section of the function will look something like this:

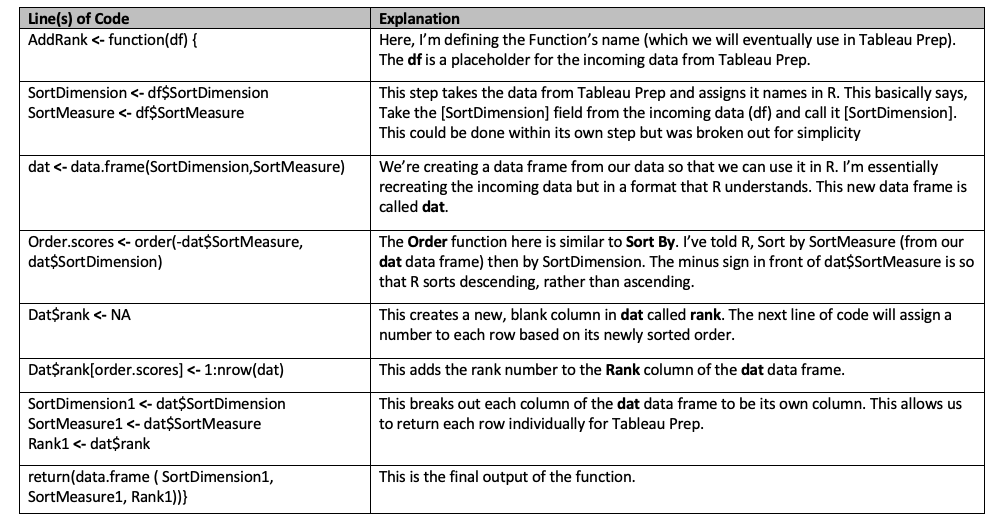
Next, I had to write a script to accept the input from Tableau Prep, add a rank according to the measure received from Tableau Prep and output the dimension, measure and new rank.
Note: You can think of <- as “equals” ( = ):

Hopefully, this can help as you move forward and start to apply your own R functions to make your data better and easier to work with. Share your success with us in the comments or reach out to our team for more direct support!

