
When I first started out as a Tableau developer, I was just trying to make sure my calculations didn’t result in errors and the dashboard rendered properly on Server. But as time went on, the caliber of dashboards became more complex and the number of developers on a project increased; I soon realized I needed a way to keep track of the inner workings behind the visualizations.
Here are a few best practices I have found to be beneficial when building dashboards so that others (and future me) can understand what’s going on behind the scenes.
Add Descriptions to Dimensions and Measures
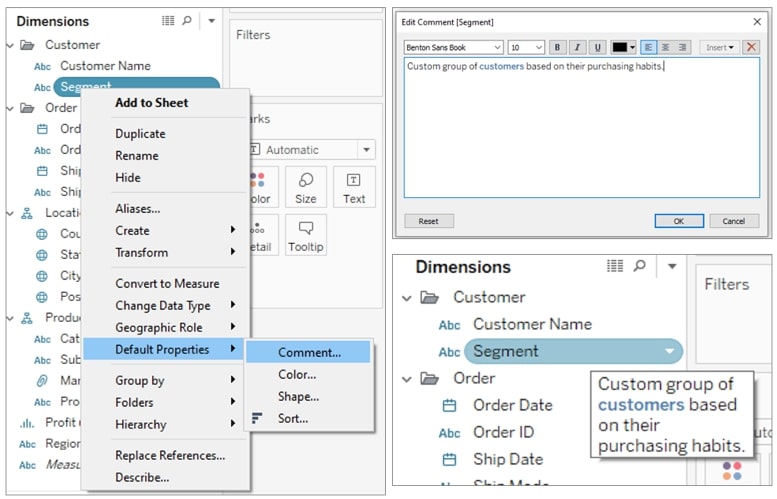
When you’re creating a data source that will be used by many people, or even familiarizing yourself with a new data source, it helps to add descriptions to your fields that appear when you hover on them in the Data pane in Tableau Desktop.
To do this, right-click on a dimension or measure, choose Default Properties and then Comment… Now, anything you enter in the Edit Comment box will show up when you hover on the field in the Data pane, and the formatting carries through, too!
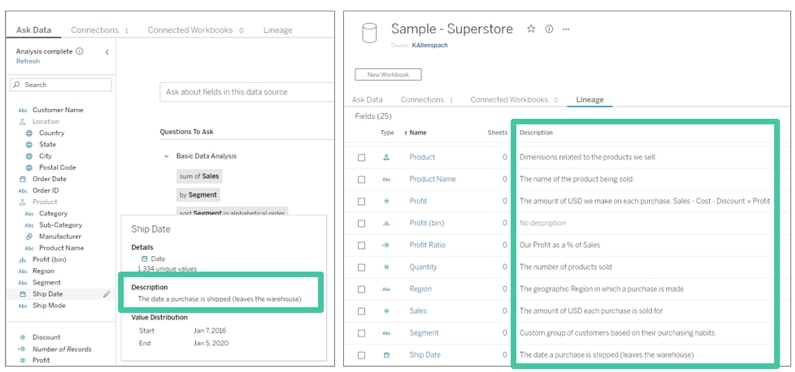
A bonus if you have the Data Management Add-on for Tableau Server: the comments you add become the Description for your fields. Users can see them when they hover on a field in Ask Data and also in the Lineage page:
Add Comments to Calculations
Often when you’re creating calculations, there will be several iterations before you get them just right. In addition, you may have several Tableau developers in a workbook over time, and it’s important to denote your thinking and logic for future users (or if you’re like me and can’t remember what you ate for breakfast, you make notes for yourself!).
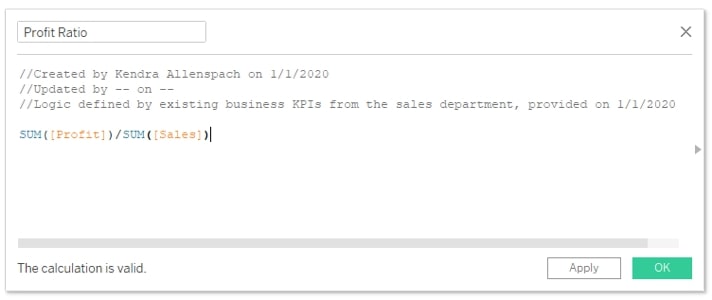
You can add comments to calculations by typing // on a line of text. I like to put things such as Created Date, Created By, Updated Date, Updated By, as well as any logic or notes I may want to remember in the future. If it’s a longer multi-step calculation, I’ll add notes in between each step of the calculation logic:
Add Captions to Worksheets
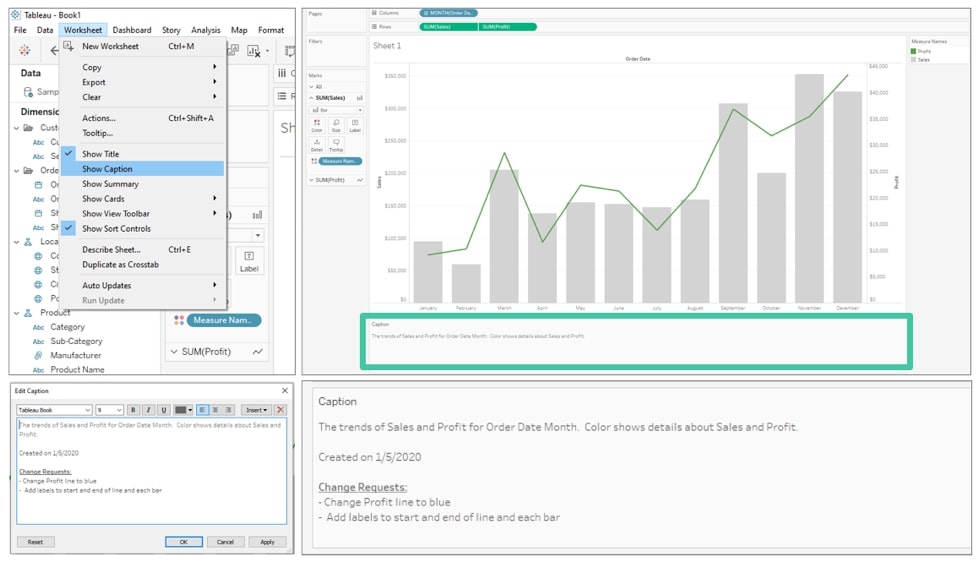
Another great way to capture notes about a specific worksheet is to add Captions. To do this, navigate to the Worksheet menu and select Show Caption. Tableau will display a generated caption that describes what is displayed in the viz, but you can actually click into the Caption and edit the text.
You can use this space as a place to log notes, change requests, changes made, etc. Sometimes, if I am building a viz that uses inspiration or instructions from a viz on Tableau Public or a blog, I will put the URL here to reference later:
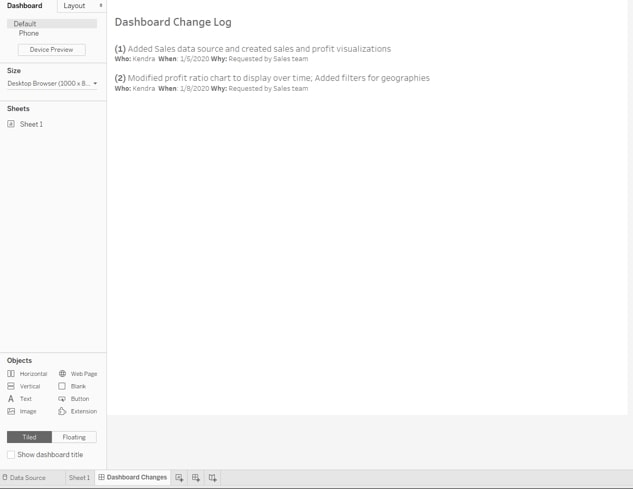
Add a Change Log Dashboard Tab
As your Tableau practice grows and you have more Tableau developers working on the same project, you’ll want to be sure to track changes you make in a Workbook for other developers to reference later. I’ve worked on several projects where I’ve inherited a partially complete Tableau workbook and had to spend time sifting through what’s been done and what hasn’t. Or even a client asking why something is the way it is and not knowing the exact answer. To help solve this, I’ve often created a change log to track change requests and when they’re complete. However, a great recommendation from a colleague of mine was to put that change log information right in the Tableau workbook.
One way to do this is to create a Dashboard tab with a Text Object as a Change Log. In it, you can keep track of what change has been made, who made it, when they made it, and even why it was made, if the request for the change came from someone else. By having it right in the workbook, you can spend less time hunting down answers and more time building and analyzing:
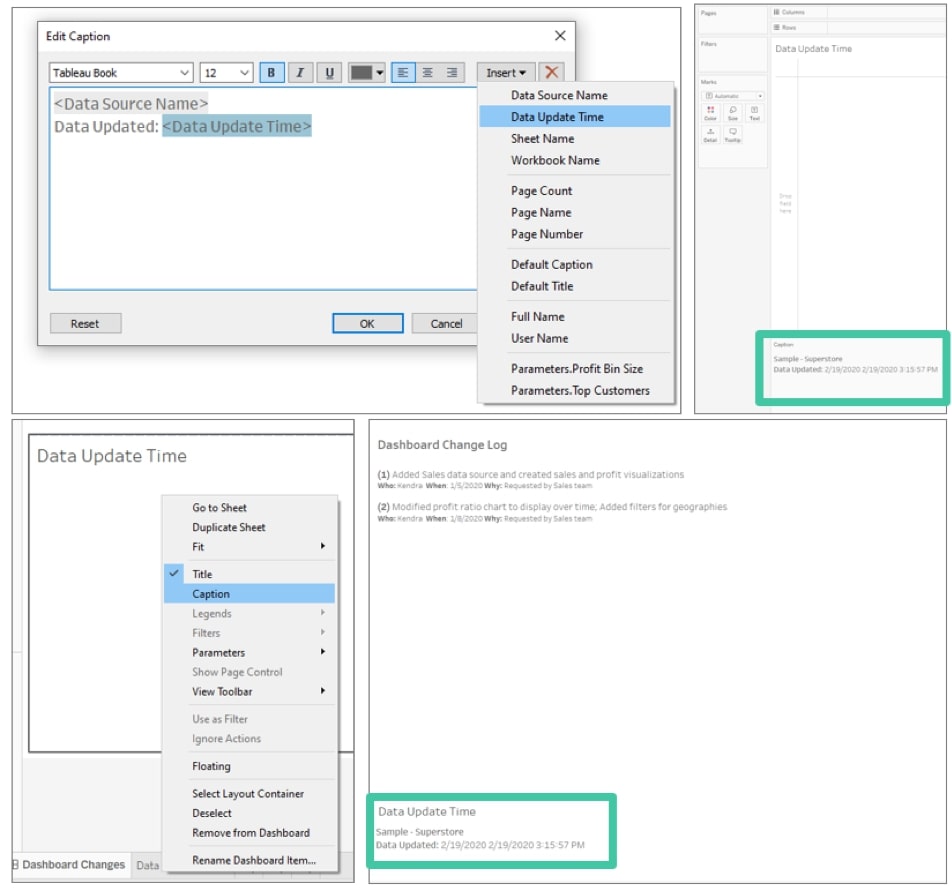
Add Latest Data Refresh Time
One of the most commonly asked questions when someone looks at a dashboard is “When was the data refreshed?” or, more usually, “Are you sure this data is current?” I’ve found it helps to provide this information front and center, so my dashboard users can answer such questions. This also helps to make sure I am working with the most up-to-date data available.
My favorite way to do this is to add the Data Source Name and Data Update Time to a blank worksheet, add the worksheet to the dashboard(s), right-click on the blank worksheet on the dashboard to turn on the Caption, and voila! – the latest refresh time for your users is now on display:
There you go! Hopefully, these documentation tips will help you and the other developers working on your same projects. It may not always seem worthwhile in the moment to add that extra description or caption, but when you come back to a project after someone else’s hands have been on it or you’ve been away a long time, you’ll be glad you did. If you have any questions surrounding documentation—or Tableau or tech in general—don’t hesitate to reach out. We’d love to help!