Connecting to a data source will likely be the very first thing you do in Tableau Desktop. Today, we will cover how to do just that, as well as some of the different options available to you. In the future, we’ll revisit this subject to cover more advanced topics, such as joins, blends and custom SQL.
Step 1: Choose Your Data Source
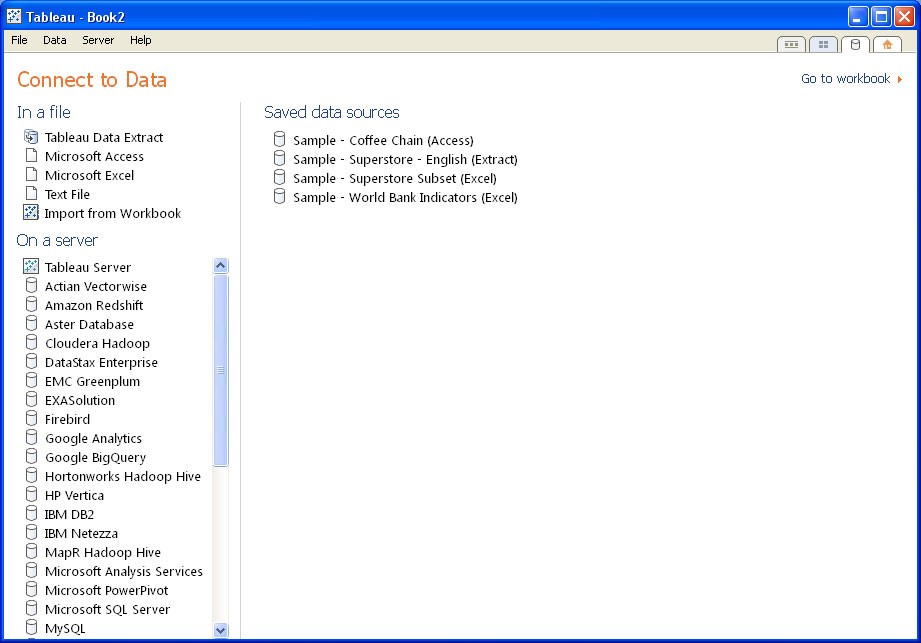
Below is the Connect to Data screen from Tableau Desktop (see Figure 1). There are multiple ways to find this screen, but perhaps the easiest is to click the Database tab in the top right-hand corner of the screen.

Figure 1: Connect to Data.
There are several types of data sources to choose from, and it can be a little overwhelming. Tableau Software is continually expanding their list of data connectors so that more and more databases can leverage their dashboards and analytics. There are even more ways to open up proprietary, legacy file types than listed above. Alteryx is a perfect BI companion for Tableau for this very reason.
Navigating this screen might be easier if you think of it as three options:
- In a File: These are data sources that are most likely local on your computer, such as an Excel spreadsheet or a text file.
- Saved Data Sources: These are sample data sources that Tableau includes automatically in your Tableau Desktop installation. These data sources are very valuable for new users because you can see the different capabilities of Tableau. You can use them as you master and test different techniques and ideas.
- On a Server: These types of data sources are located on a server in your network. Tableau has prepared data connectors to enable you to use these file types within Tableau Software. There are several from which you can choose. If you are unsure about the type of data source and its location that you’ll need to connect with, be sure to check with your system administrator for more information.
You might be wondering, why are there so many types of data sources? Beyond the commercial aspect of competing products that offer similar capabilities, data can appear in a lot of different types, sizes and functions. For example, Microsoft Excel is great for working with hundreds of rows, but you’ll need a different product entirely if you’re trying to manage millions of rows.
Step 2: Connection Options
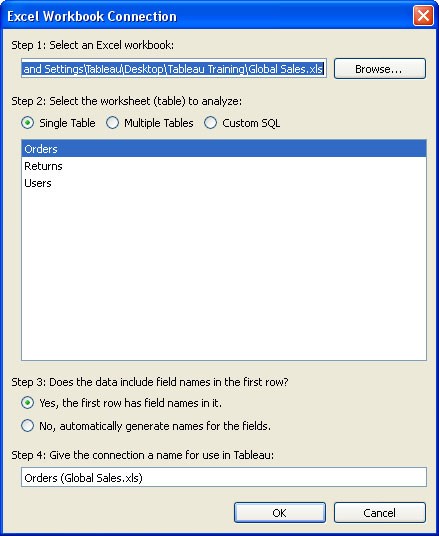
Once you choose your data source, a file browser will appear for you to find the location of your data source. Once you have chosen the data source, another window will pop up (see Figure 2). In our example below, we have chosen to connect to an Excel file by clicking on Microsoft Excel under the In a File heading.

Figure 2: Data source options.
This window has four steps before you can click OK.
- Step 1: Your data source and its location are presented here. You can click the Browse button to choose a different one.
- Step 2: Within your data source, there might be multiple tables or worksheets. You can choose to analyze a single table (default) or multiple ones. The tables and/or worksheets are listed in the text area below. Multiple tables or custom SQL are beyond the scope of this Tableau Essentials article.
- Step 3: Often in Excel, the first row will have field names (CustomerID, Customer Name, etc.). These radio buttons indicate to Tableau whether to use these names in their breakdown of dimensions and measures.
- Step 4: You can give the workbook connected to this data source a name within Tableau Desktop. Tableau will automatically create a file name based off of the table name and the name of the data source.
Step 3: Connection Type
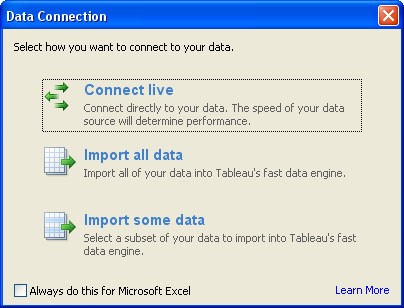
When you click OK, the final window will appear. So far, you have chosen your data source type and location (Step 1) as well as the worksheets or tables (Step 2). You will now choose how to connect to the data.

Figure 3: Data Connection.
You have three options here:
- Connect live: By clicking this option, Tableau will connect directly to your data source and use real-time data as it refreshes or updates. This option can affect performance in Tableau if your data frequently refreshes or is quite large.
- Import all data: Using this option, you will take all of the data from the data source and store it within Tableau’s fast data engine. This option will increase the file size of your workbook, but it can increase the performance of your dashboard.
- Import some data: This is similar to the above option. Instead of importing the entire data source, you are selecting only the essential parts you need to complete your analysis. This is a useful option if you have a large data source or multiple fields within your workbook or table that aren’t needed for your workbook.
The Data Connection window is the last step. Clicking one of the options will take you to the worksheet view within Tableau. All of your dimensions and measures will be laid out in the Sidebar, and a blank canvas will be ready for your visualization masterpiece.
Conclusion
There you have it! Connecting to data sources in Tableau is a pretty straightforward and fluid process. With so many options and supported connections, it’s easy to see how Tableau attracts such a large and diverse group of fans.
Want to learn more about Tableau? Here are the other Tableau Essentials posts we have so far:
- The Toolbar (Interface)
- The Sidebar (Interface)
- The Worksheet Canvas (Interface)
- Measures & Default Properties
More articles are coming soon, so check back regularly.
As always, let us know if you have any questions or comments about this post or Tableau in general. If you’re looking for personalized training or help with something bigger, contact us directly!

