
The Toolbar
Below is a screenshot of the Tableau worksheet interface connected to a generic Excel datasource (Orders). We will focus exclusively on the row of buttons just below the menu drop-downs at the top of the page – the Toolbar.
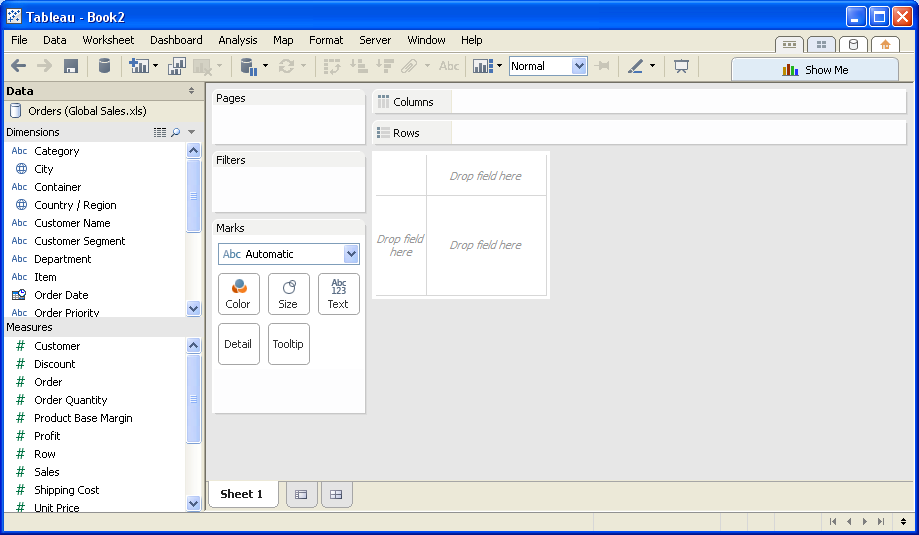
Tableau often has multiple ways of completing a single task – drop-down menus, right-click menus, contextual controls, hot keys and the Toolbar. The best way to find the easiest method for you is to just jump into the interface and start working.
The Buttons
Each button in the Toolbar has been individually numbered in the picture below, followed by an overview description:
![]()
1. Undo: This will be your best friend. It does exactly what it says, undoing your last action. The Undo button keeps track of your progress, so if you need to, you can undo multiple actions with multiple clicks
2. Redo: If you undo an action and want to do it again, press Redo. To get a quick look at the before and after of a change you’ve just made, you can click back and forth between Undo and Redo until you’re satisfied.
3. Save: Save your workbook. It will bring up a Save As window if you haven’t saved it yet.
4. Connect to Data: Connect to a data source. This will take you to the Connect to Data tab, also accessible by the clicking the database icon on the top right hand tabs of your worksheet.
5. New Worksheet: Create a new worksheet. There is a drop-down arrow here that gives you the option of creating a new dashboard. This does not erase your current sheet, but instead creates a second one. You can switch between your sheets by clicking the tabs at the bottom of the screen.
6. Duplicate Sheet: Just like the New Worksheet button, except the new worksheet is an identical copy to what you currently view in your canvas work area.
7. Clear Sheet: All of the dimensions, measures and work in the Pages, Filters and Marks cards are erased. This is essentially your start over command. The drop-down arrow on this button allows you to selectively clear certain aspects of your worksheet, such as just the formatting or removing the filters, etc.
8. Pause Auto Updates: Each time you make an addition or adjustment to your worksheet, such as dragging a new dimension onto either the Row or Column shelf, Tableau will automatically update your view. If you’re using a large data source, this can take a few moments to update.
Pausing the Auto Update allows you to make additions or adjustments without that automatic update (and potential lag in performance) until you are ready to update all at once. When there are pending updates, your worksheet will grey out as an indication.
Clicking it a second time will resume Auto Updates.
9. Run Update: While your Auto Updates are paused, pressing the Run Update button is a manual way of updating your worksheet with whatever changes you have made since the last update.
10. Swap: Pressing the Swap button will flip the rows and columns. The y-axis will become the x-axis and vice versa. Also, all of the fields in the Row shelf will swap with the Column shelf and vice versa.
11. Sort Category by Ascending: Your measures will sort from lowest to highest in your worksheet.
12. Sort Category by Descending: Your measures will sort from highest to lowest in your worksheet.
13. Group Members: Grouping has two different functions depending on whether you select dimension members or marks in your worksheet. If you select multiple dimension members in your worksheet, click Group and follow the drop-down arrow to Category, you will combine those cells into a category represented in a single dimension member.
If you group by clicking on several marks in your worksheet, then you’ll make those marks the primary emphasis of your worksheet. The other marks will grey out, and the grouped marks will remain colored as a means of highlighting their relationship.
14. Show Mark Labels: Turn on or off labels on your marks. For example, if you’re using a Profit measure in your worksheet, turning on a label will place a currency amount over each mark. You can, of course, adjust the label’s content and formatting in the Marks shelf.
15. Show/Hide Cards: This button actually gives you a series of options from the drop-down arrow. It allows you to customize your canvas work area by choosing what you want visible and invisible. Options include:
- The Marks card
- The Title, Summary and Caption fields
- The Row, Column, Pages and Filters shelves
The best way to get a feel for all of this is to just test what each button does. It won’t affect your worksheet in any way. You’re just arranging some of your tools. Those items that are currently selected to appear will be designated by a checkmark.
16. View Dropdown: This drop-down menu tells Tableau how you want to fit your worksheet within the canvas work area. The default view is Normal, which will create a worksheet appropriately sized to your fields.
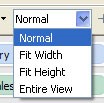
- Fit Width will stretch the worksheet to fill the entire horizontal space of the canvas.
- Fit Height will stretch the worksheet to fill the entire vertical space of the canvas.
- Entire View will stretch the worksheet to fill the entire space of the canvas, both vertically and horizontally.
17. Fix Axes: By clicking the Fix Axes button, you will fix the range of the axis to whatever is currently displayed. If your changes to the worksheet make the data in that axis greater than that range, it will be cut off. Clicking this button a second time will revert to Tableau creating an axis of the appropriate length to reveal all of the data in the worksheet.
18. Highlight: The Highlight button adjusts how highlighting will be displayed in your worksheet. Highlighting is used to emphasize the aspects of your worksheet that you think viewers will be most interested in seeing.
19. Presentation Mode: The worksheet will go full screen, covering up the Tableau worksheet interface. This is a great way to use your worksheet as a talking point without the clutter of all the worksheet controls and cards. You can get out of this view by clicking the same button at the bottom right of the screen or by simply pressing ESC.
Mastering the Basics
Now that you have the toolbar down, you’re one step closer to mastering Tableau! We’ll be publishing new Tableau Essentials posts regularly and will link to them here, so come back to visit often! In the meantime, check out our other Tableau-related blog posts on basics and advanced techniques alike.
Here are the other Tableau Essentials blog posts we have so far:
- The Sidebar (Interface)
- The Worksheet Canvas (Interface)
- Measures & Default Properties
Want proof of our Tableau training street cred? InterWorks was the Tableau Partner of the Year in 2013 as well as the very first Tableau Gold Partner. You can ask us anything in the comments below or contact us directly. As you can tell, our people love any reason to talk Tableau.