While minimizing costs for infrastructure has always been a concern, with more companies moving to cloud platforms, there’s never been a better time to re-evaluate the operational costs of applications.
Previous InterWorks testing showed Linux performed much better than Windows; however, because the Linux version of Tableau Server that we tested used Hyper and the Windows version didn’t yet have it, we never had a great indicator of how much those gains were due to Hyper versus the operating system.
Over the past couple years, we’ve felt like Tableau Server is faster on Linux, but we’ve never had cold hard data to back up these feelings. Enter this testing suite where we put our data where our mouth is!
The Tests
The setup for this test is a little contrived. I needed the ability to fully saturate the servers quickly while not being limited by my source data or my machine’s ability to send many requests to the servers themselves. I didn’t want to spend too much time fixing workbooks or running tests only to find out that my workbooks were behaving so poorly that no server would have run them well. I needed to test scenarios where the server was saturated and where the server is idle to make sure there isn’t a true runaway winner in the brawl.
While I tried to use scenarios that were accurate to real life, your mileage may vary depending on your actual workload and use cases.
We’ll do a call back to 5th grade science class and use the scientific method to set up our tests.
Hypotheses: Linux runs about 5-10% fast than Windows on average. AMD will perform similarly to Intel, perhaps a bit worse.
Testing methodology/criteria:
- With a newly initialized server (read: totally empty), how long does it take to run a tsm restart?
- Linux uses time -p tsm restart
- Windows uses measure-command {tsm restart}
- Using TabJolt with 1, 5, 10, 15 and 30 concurrent threads, what do average response times look like, and what does the error rate look like?
- Two workbooks with four dashboards total were pulled from Tableau Public and run against a Snowflake database where datasets are cached early on.
- After these tests have been completed, how long does an extract refresh on a CitiBike table take to run?
The Results
For the tsm restart test, the clear winner is Linux. Here are the average restart times:
- Linux (AMD): 320 seconds
- Linux (Intel): 329 seconds
- Windows (AMD): 521 seconds
- Windows (Intel): 540 seconds
Interestingly, the Linux restart times were also more consistent, with a standard deviation of seven seconds compared to Windows’ 26 seconds.
For the TabJolt test, the clear winner is again Linux with the average response time of Windows being 48% slower than Linux:

Details on the individual runs are included towards the end of this blog post.
For the extract refresh test, Linux came out on top once more completing the refresh 10% faster than Windows. Here are the averages:
- Linux (Intel) : 300 seconds
- Linux (AMD) : 318 seconds
- Windows (AMD) : 330 seconds
- Windows (Intel) : 355 seconds
Conclusions
Knowing now that Linux is faster than Windows in all scenarios tested, what other factors should be considered when determining if Linux is the right platform for you to run Tableau Server on?
- Operational costs: Linux is between 40-50% cheaper than Windows on all public clouds, as Windows licensing is bundled with compute cost.
- Administration: Linux doesn’t have a desktop graphical user interface. All server administration needs to be done through a command line interface, which can be intimidating. The TSM Web UI on Linux is identical to Windows, however.
- Data source compatibility: Not all data source types are supported on Linux by Tableau. Be sure to check out Tableau’s driver list here (drivers with an asterisk are Windows-only).
If you’re looking to stretch your Tableau Server as far as possible on your budget, our tests show that not only does Linux cost less to run, but it’s also able to handle higher loads than Windows, perform maintenance operations quicker and return lower dashboard load times.
As tested, you can also save up to 10% on your cloud compute bill by choosing AMD CPUs over Intel and get the same – or slightly better – performance.
Stats for Nerds
It wouldn’t be science if I didn’t show my work! Servers were all c5.4xlarge (Intel) or c5a.4xlarge (AMD) running Ubuntu 18.04 or Windows Server 2019 Base with Tableau Server installed on a GP3 storage drive. Here’s the cost breakdown for what each of those cost to run in an “average” 732-hour (30.5 day) month:
- c5.4xlarge (Windows): $1065
- c5a.4xlarge (Windows): $1020
- c5.4xlarge (Linux): $530
- c5a.4xlarge (Linux): $480
Diving into the TabJolt test, the chart here shows an error initially with Intel on Linux, but then the runs look virtually identical. On Windows, the response times are much longer but trended the same between Intel and AMD:
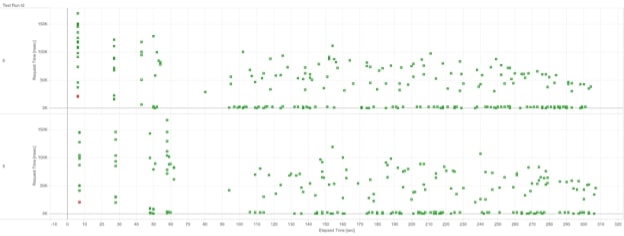
Above: Linux AMD (top) vs. Intel (bottom)

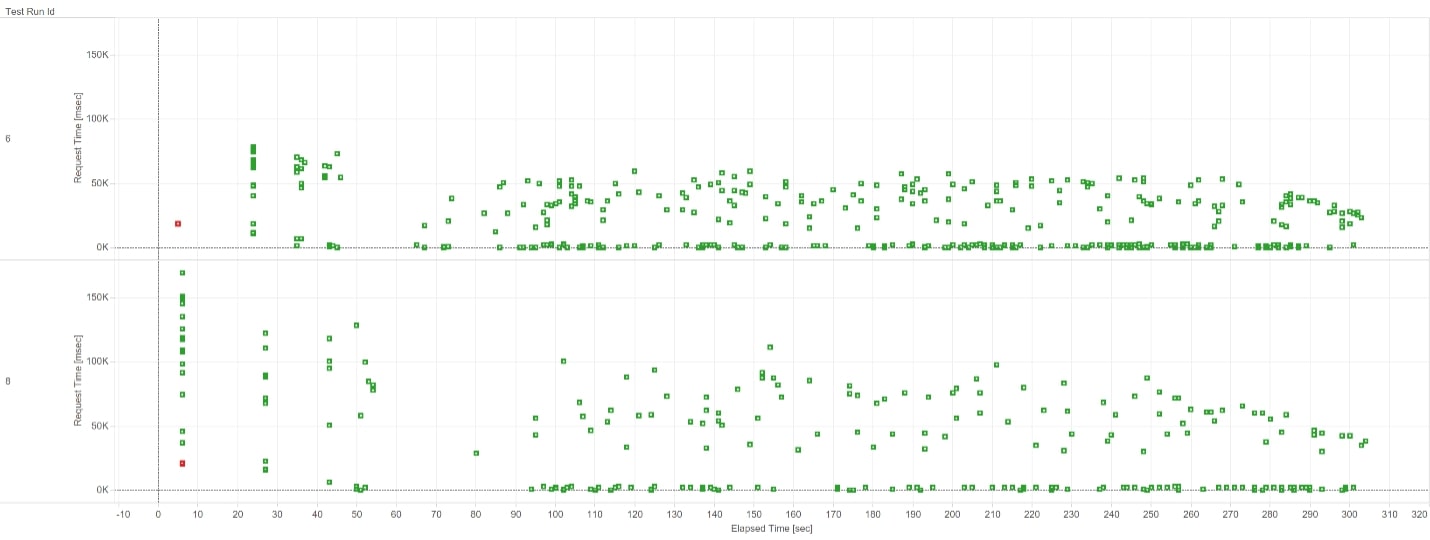
Above: Windows Intel (top) vs. AMD (bottom)
Between these charts, note that the scales are different for the y-axis.
Starting with the TabJolt runs with 30 threads and looking at Linux vs. Windows, Windows averaged twice as long to return dashboards and started the run with 11 errors. However, none of those errors occurred after the first dashboards were returned, indicating that there is a bug in the Windows version of Tableau Server when running with TabJolt. The number of tests returned for Linux is roughly twice the number as for Windows because the server returned dashboards in half the time. The response time is about 44% slower on Windows on average. Moving to 15 threads, the same trend continues with Windows being slower on average by about 31%. With 10 threads, Windows is 45% slower for responses. Five threads puts Windows behind by 52%. One thread Windows is slower by 48%. These numbers are close to a target of about 50% slower performance on Windows:
Above: 30 Threads Linux (top) vs. Windows (bottom)
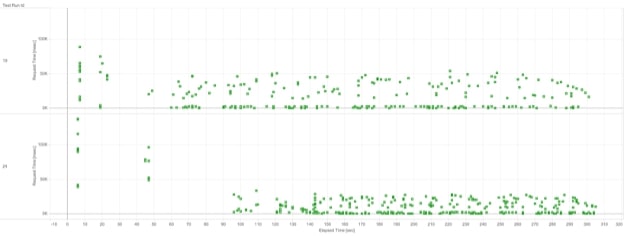
Above: 15 Threads Windows (top) vs. Linux (bottom)
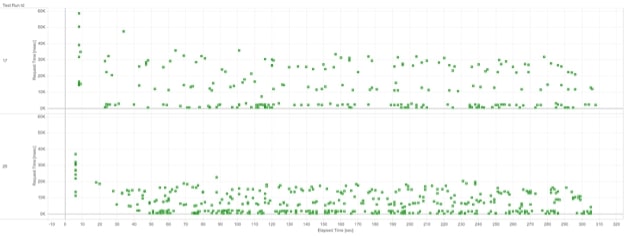
Above: 10 threads Windows (top) vs. Linux (bottom)
Running these tests using Hyper workbooks vs. live connections uncovers disk-read speeds and ensures that queries back to live databases is not a bottleneck. With 10 threads, Windows was 39% slower. With 15 threads, Windows was 42% slower. With 30 threads, Windows was 37% slower:
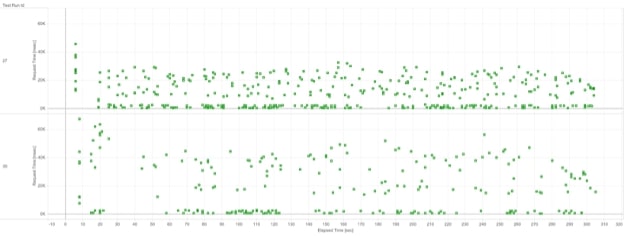
Above: 15 threads Linux (top) vs. Windows (bottom)
Analysis and Findings
In all the tests we ran, Linux was 1.5 to 2 times faster than Windows. This might not be fully representative in real-world scenarios, but some improvements should be at least partially realized in real-world scenarios. Both instances were running with gp3 disks in AWS with the same number of IOPS and throughput configured. This means that it should come down purely to the operating system’s ability to read and write data to/from the disk.
Using Hyper vs. live connection tests allows us to determine that using Snowflake as a backend did not conflate our results with a query to a live database being the slow part of rendering the dashboard. It also allows us to test read speeds from hard disks for Linux and Windows for the initial tests before data was kept in the memory cache. There will be a point that both Snowflake and Hyper data is kept in Tableau Server’s memory, meaning that tests come down purely to the OS’s ability to serve dashboards as fast as possible. Looking at the average load times over a five-minute test will reveal this true number vs. a number that includes querying a database, loading that data and then rendering the viz.
Refreshing extracts is slightly more contrived because the drivers for Windows vs. Linux might be more optimized for one over the other. Since the same version of the driver was used and it was pulled from the same data source, the results should be safe to compare.

