This series examines some advanced techniques of Tableau Tooltips and will help you effectively build upon an already solid foundation.
In this post, we’ll be looking at how we can use a tooltip and worksheet actions to highlight, rather than filter, a data point in our target viz. Here, the primary viz shows the sales by Sub-Category, and the tooltip shows where that Sub-Category sits in a bar chart of profit:
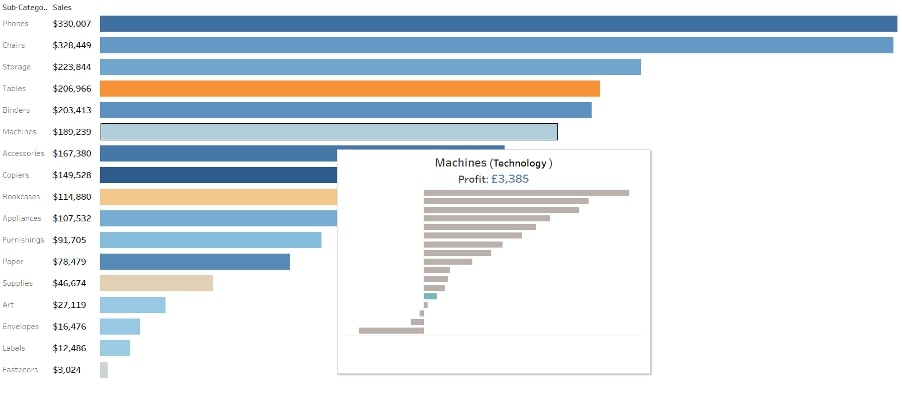
First, we build the charts (one by sales and one by profit), but at first, the filter action will mean we only see one bar on our target table. To resolve this, we need to manually adjust the string in the Edit Tooltip box as below:
![]()
Now that we have removed the filter, we will see all records. But we don’t have an easy way of seeing where the sub-category we are viewing sits in the target chart:
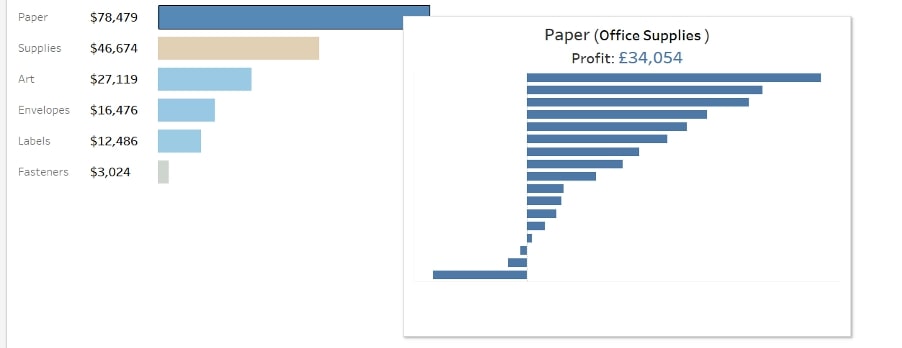
Targeting with Parameters
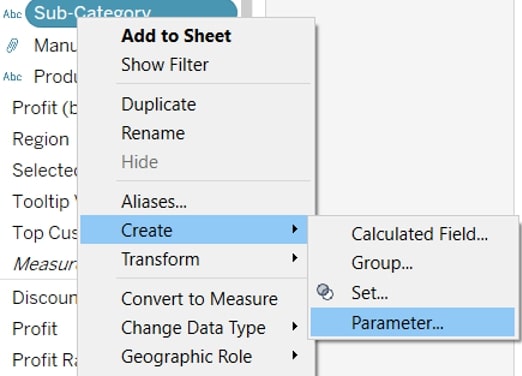
To get around this, we need a parameter and a parameter action. First, build a parameter from the dimension you are wanting to highlight (right-click in the Dimension pane > Create > Parameter):
Then create a Boolean field for your selected Sub-Category:

And bring this new field to Color in the tooltip viz:
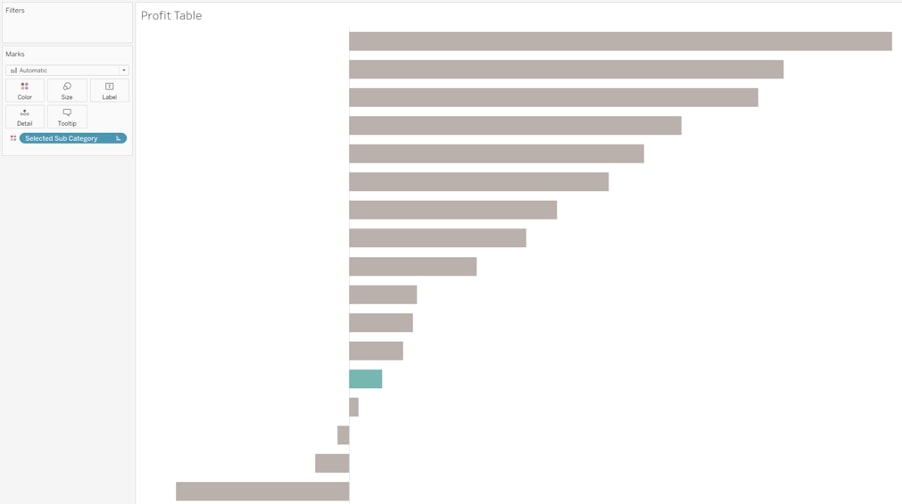
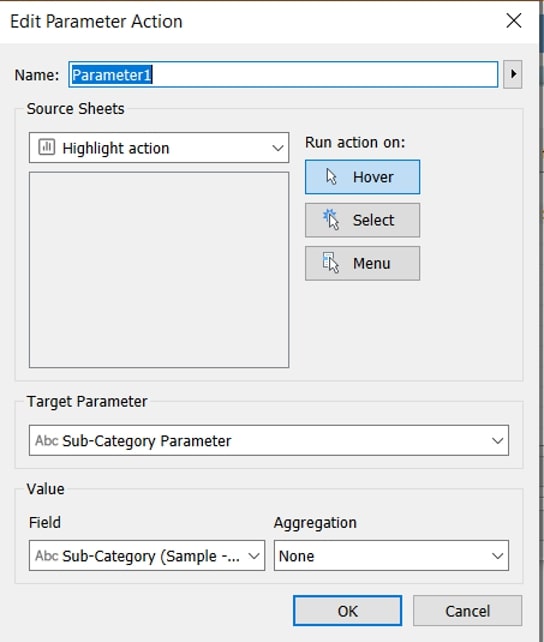
Now we need to add an action to control this parameter. In the worksheet Actions menu (for the main viz), add a parameter action as below. Make sure the action runs on Hover:
The tooltip action will run faster than the parameter action at first, so to make sure your tooltip is accurate, go into the Edit Tooltip window and make sure they are set to run On Hover, rather than instantly:

You can use the same technique to drive any parameter-based formatting between your primary sheet and your tooltip viz.

