Last week, we shared a link to InterWorks and Princeton University’s sponsored session at Tableau Conference 2015. Today, we’d like to share even more sessions from some of InterWorks’ friends and clients. Below, you can discover how Arby’s and Cars.com have used Tableau to forever change the way they look at their data. To view the sessions, you must first log into Tableau’s virtual conference site. Once logged in, you should be able to view the sessions linked below.
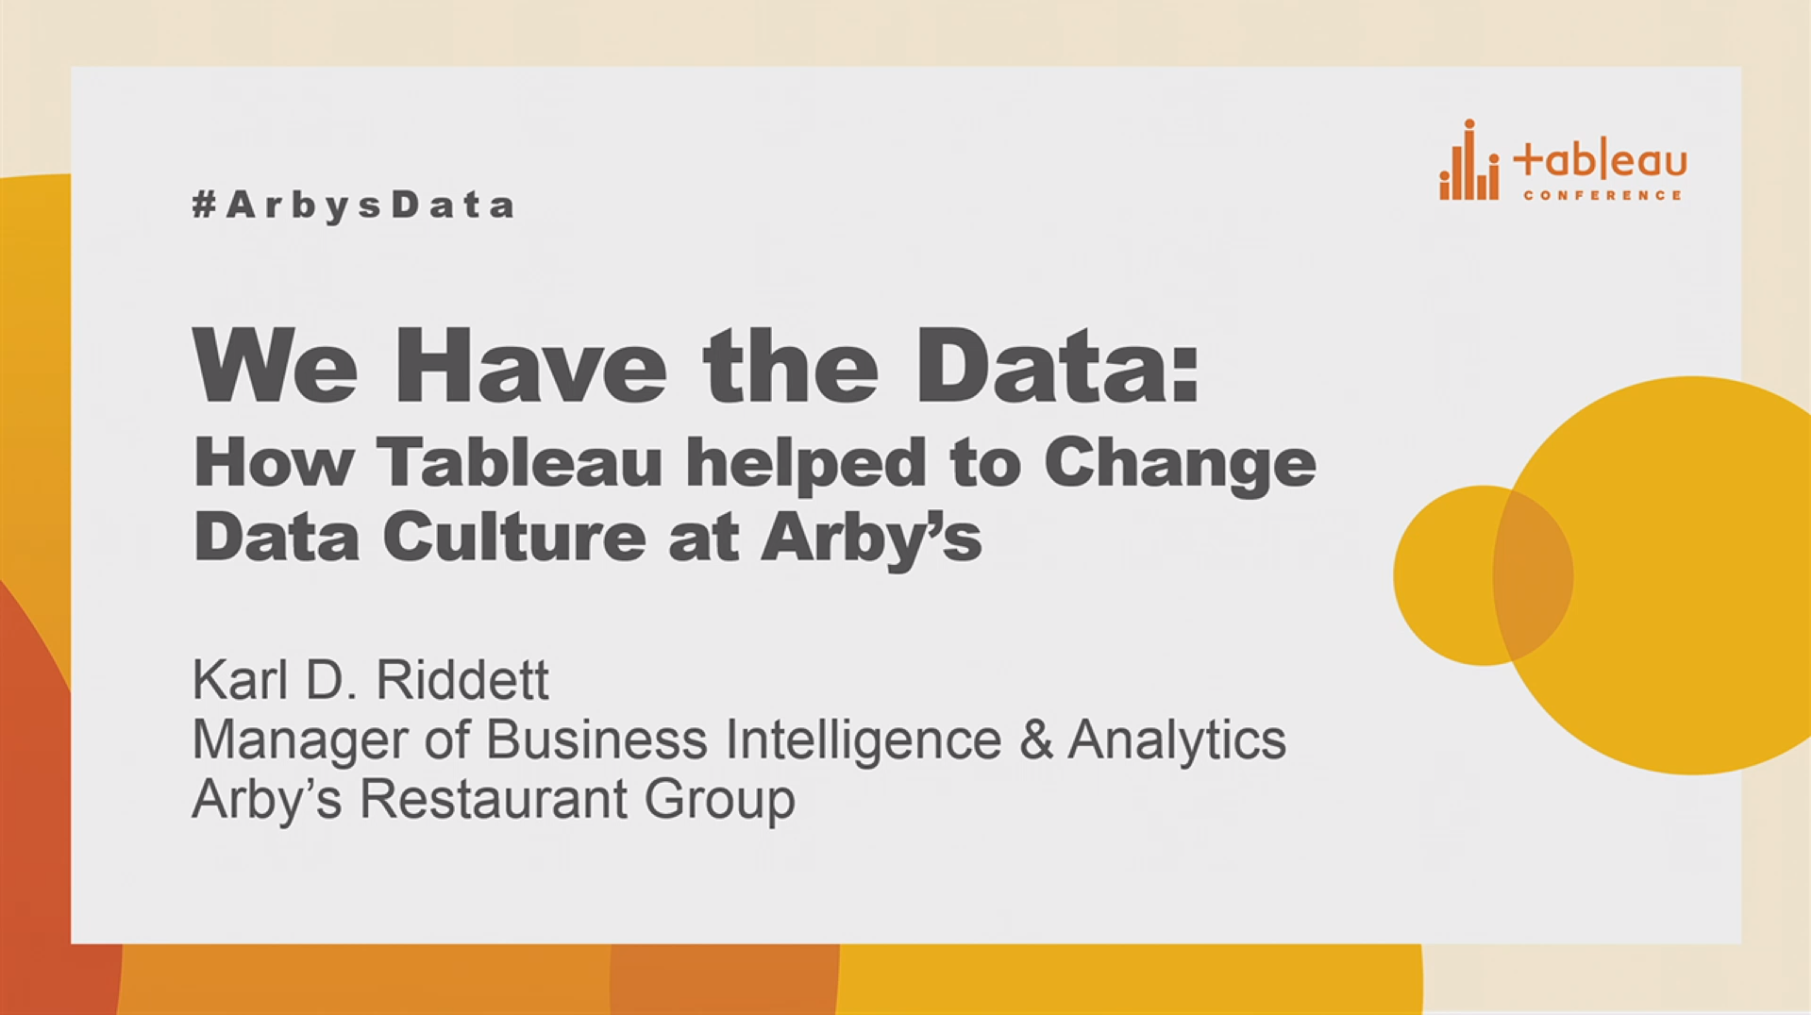
We Have the Data: How Tableau Helped to Change Data Culture at Arby’s
Karl Riddett, Manager of Business Intelligence & Analytics, talked about the data explosion and Arby’s journey to harnessing their own data ecosystem. The primary goal in this endeavor was creating a culture of self-service analytics, Tableau being the cornerstone. In order to achieve this, Karl explained how they used Tableau to tell the business something they didn’t already know. He shared several examples, including a Snowmageddon dashboard in Tableau to analyze a dip in sales during that time as well as a Remodel Report used to analyze Arby’s store remodeling efforts. Karl went on to explain how Tableau has impacted almost every aspect of Arby’s business.
To learn more about Arby’s data journey, specifically how Power Tools for Tableau helped accelerate that journey, check out this InterWorks case study.
Cars.com: Using Tableau to Gain the Trust of 20,000 Automotive Dealers with Value Analytics

Jeff Bloomfield, Senior Business Intelligence Analyst, and Jeni Pecard, Senior Value Analyst, explained why they chose Tableau as a data visualization solution, their processes for creating successful dashboards, how they ensured adoption/ROI and how they gained the trust of their customers through engaging reports built in Tableau. As part of their processes, Jeff mentioned how Workbook Tools for Tableau helped them measure performance and how Enterprise Deployment Tool for Tableau automated workbook and data source promotion to their three different sever environments. Both Jeff and Jeni walked through several dashboard examples and how those have evolved to where they are now.


