Tableau in the Cloud
Tableau and Google already form a potent mix, as Tableau supports a number of Google’s data sources with native connectors, such as Google BigQuery, Google Analytics and Google Cloud SQL. But as of last month, Tableau Server is certified for use on Google Compute Engine, Google Cloud‘s computing product. With this you can host your very own Tableau Server on a virtual machine in the cloud while having all the advantages of hosting a local Tableau Server – scaling up and out, high availability, failover and so on.
Google Compute Engine
But what exactly is Google’s Compute Engine? GCE, similar to Amazon’s EC2, is an “Infrastructure as a Service” component of the Google Cloud which is built on the global infrastructure that runs Google’s search engine, Gmail, YouTube and other services. Google Compute Engine enables users to launch virtual machines on demand.
Tableau says that getting started only takes a couple minutes, which I want to take to the test – everybody here at InterWorks loves a good challenge. And while I am at it, I am going to pit it against a comparable virtual machine on Amazon’s IaaS called Amazon Web Services (AWS). So, let’s just jump straight in!
Setting up an instance
As we have grown to expect from Google, the web interface of the Google Cloud makes a really clean and solid impression. To get started with our Tableau Server installation we need to complete these three steps:
1: Create a project and enable billing for it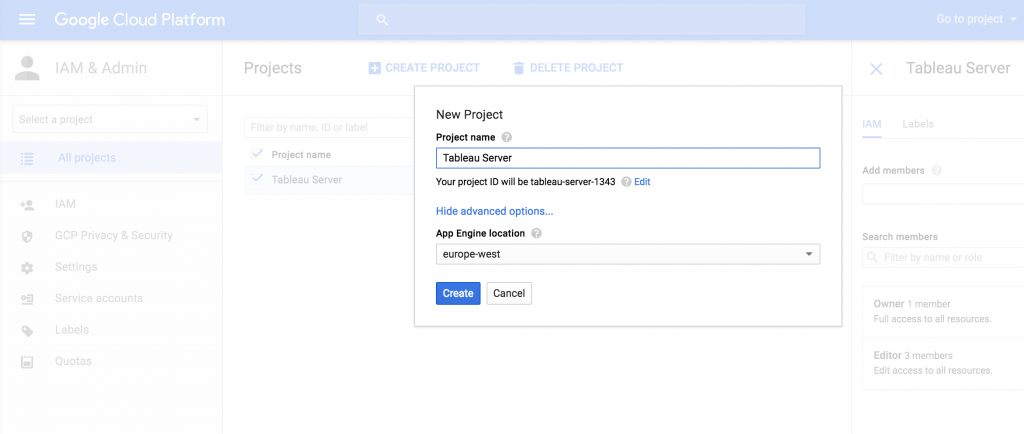
2: Configure the virtual machine
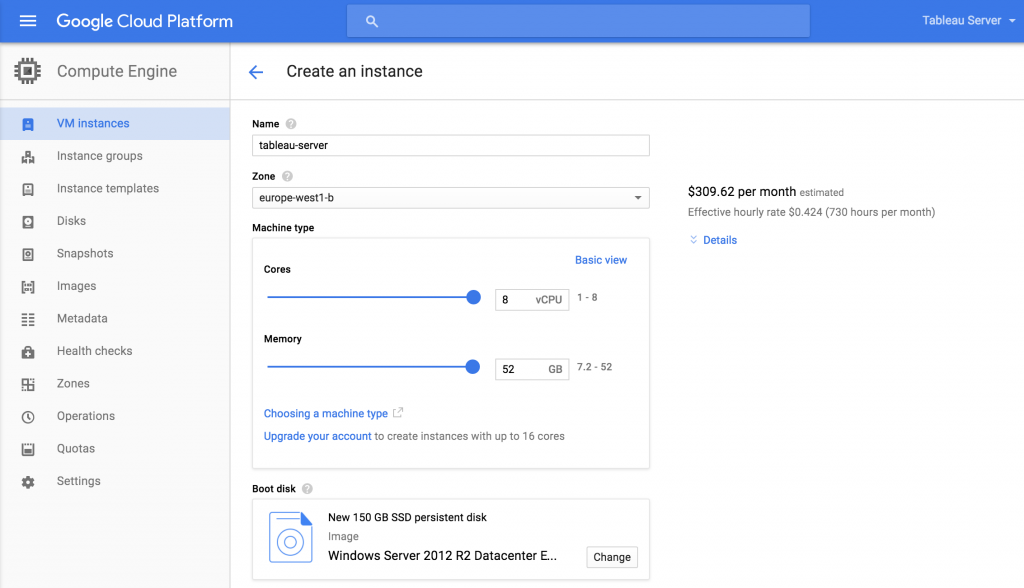
3: Spin it up and connect to it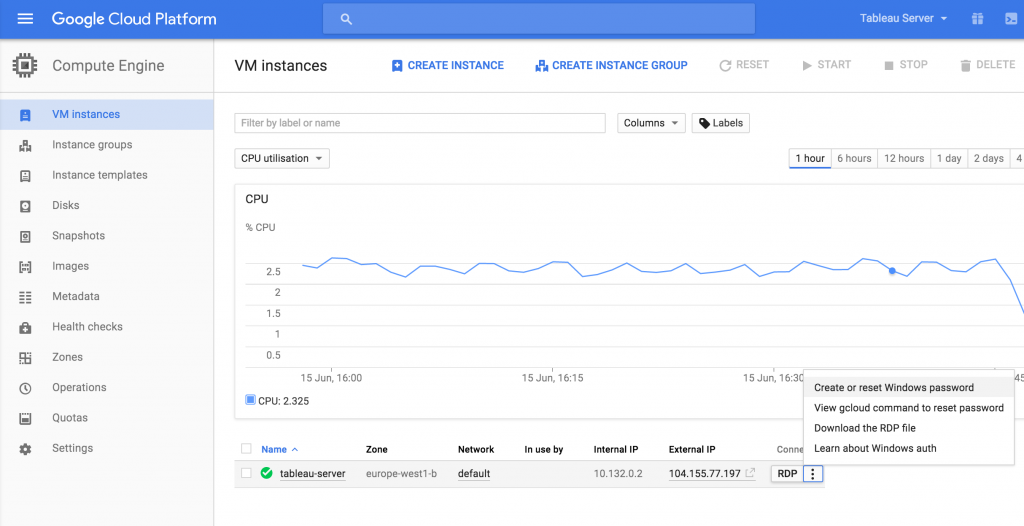
The instance boots up really fast and I connect to it about three minutes after having started the whole process. So far, so good. My next step takes me to download the current build of Tableau Server 9.3 64-bit, which takes seconds to complete (here’s to Google Fiber), and begin the installation process.
Installing Tableau Server
Very much like starting up the instance on Google Compute Engine, installing a single node Tableau Server in the standard configuration is very straightforward and easy.
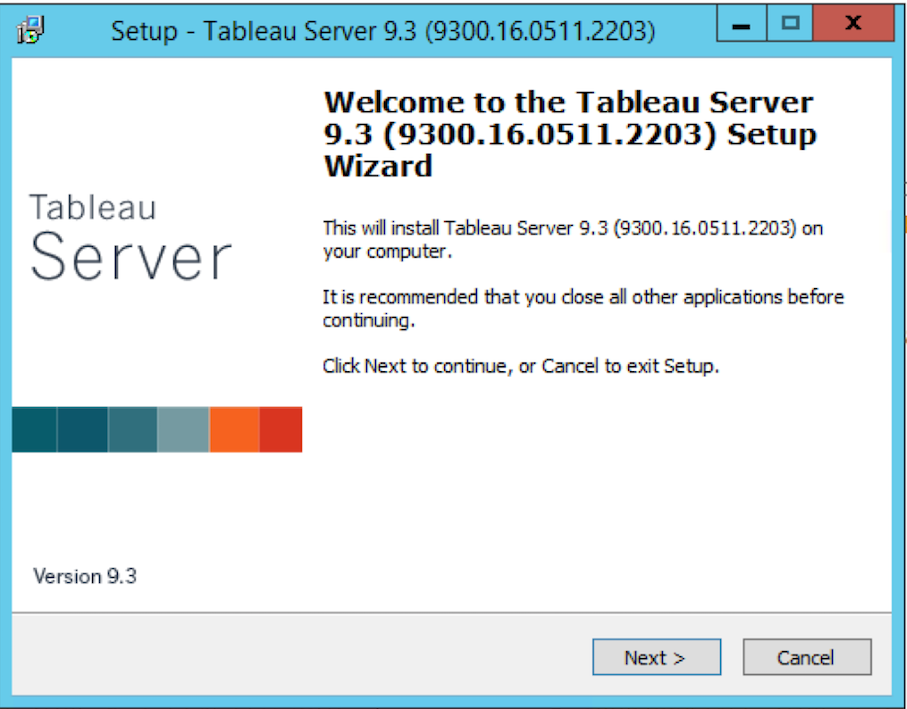
The installation wizard checked for the minimum requirements and quickly deemed the GCE instance worthy of living on. Next, I have to choose a standard Tableau Server configuration and continue with the installation process.
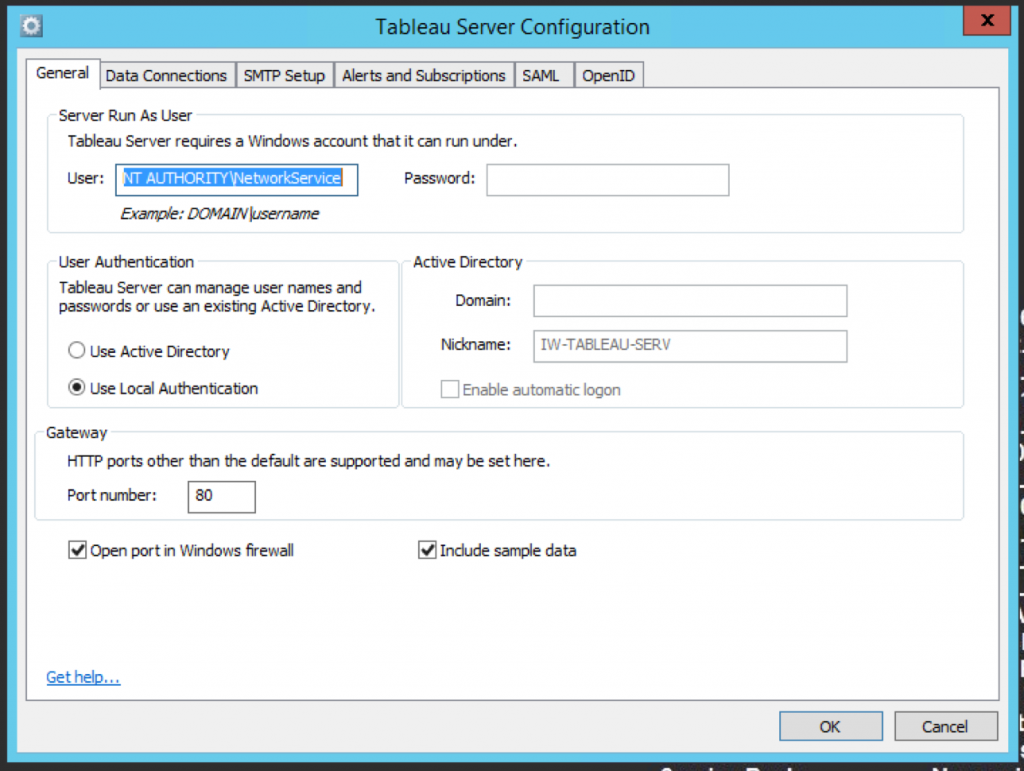
Done. Now all I have to do is to set up an administrator account on Tableau Server and I am all set.
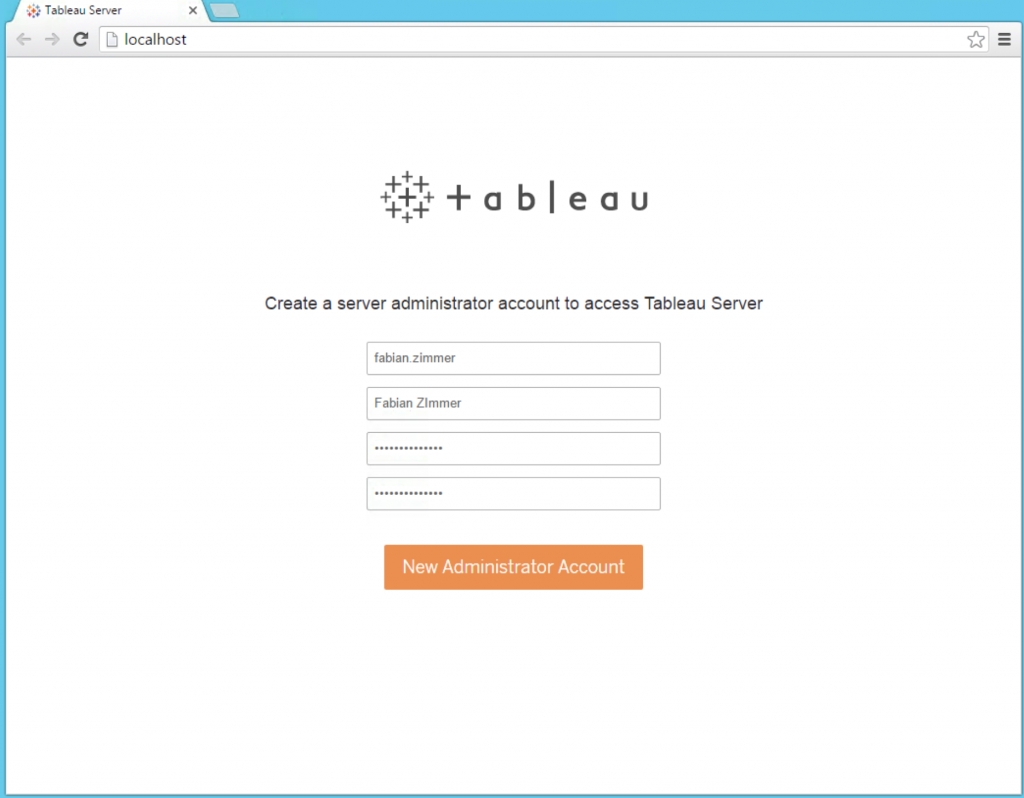
Time from start to finish: 11 Minutes! That’s what I call fast.
Performance Test using TabJolt
Why run a Tableau Server if not to upload and share informative and well-crafted dashboards, or to hammer it with requests until it breaks during a load test. We already do the former a lot, and the latter always sounds like a lot of fun to me. So, I published a dashboard, installed and configured Tabjolt, and started to hit the server with ever increasing numbers of concurrent requests.
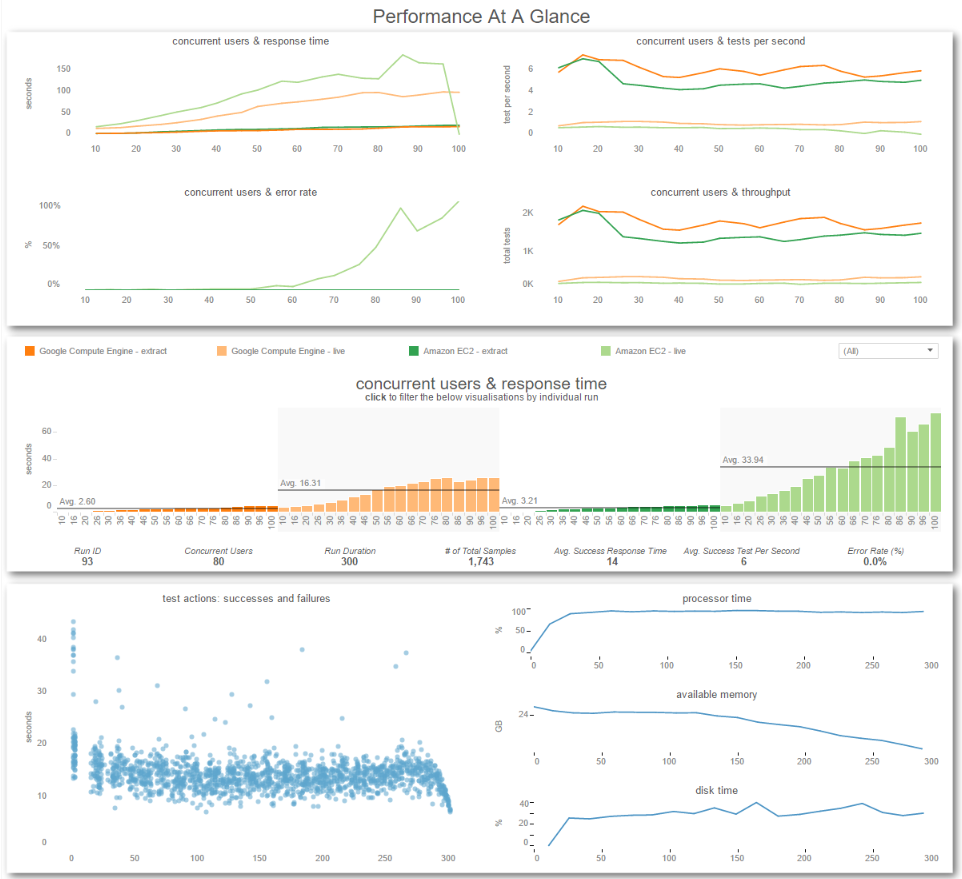
The tests ran for 300 seconds each and increased the number of simulated concurrent user in increments of five, starting at ten and moving all the way up to 100. I ran all the test two times, testing the same dashboard with both a live Google BigQuery connection as well as with a data extract. And then, mostly to satisfy my own curiosity, I ran both tests against an identically configured Amazon EC2 instance.
Lo and Behold: The Results
Click the image to view the dashboard on Tableau Public
As you can see from the top third of this dashboard, Google’s GCE performed slightly better in terms of both total and average requests completed successfully, and Amazon’s EC2 is almost on par with the response time – using an extract. The test using a live data connection showed quite some different results. The response time and error rate on the AWS instance are noticeably higher compared to the GCE instance; but in all fairness, we are talking about a Google BigQuery data source here, so I wouldn’t read too much into it.
My Takeaways
I really enjoyed setting up a project and virtual machine using Google’s Compute Engine, the ease of use and the beautifully minimalistic interface have already made a lasting impression. Managing your projects and virtual machines using the Google Cloud dashboard is straightforward and easy to learn. And last but not least, the measured performance really convinced me. Bonus points when you’re going to use live connections to Google data sources.

