
It can be a very confusing or frustrating experience whenever a technical tool doesn’t do what you want it to do, or even what it should be doing using common sense! I recently had some issues with the mapping visualization feature in Power BI and was able to solve the problem, so I want to share my insights with you in case you are facing a similar problem! I have filmed a short tutorial video that you can watch below or continue reading:
In this blog, I will discuss two problems: One where Power Bi is mapping incorrectly based on the level of detail in the view, and secondly where we need to alter our data to get Power BI to see the location in the right place. This second example is similar to the “unknown” icon in Tableau, where the mapping software is either seeing points with ambiguous names, or those not in the system.
Ambiguous Names
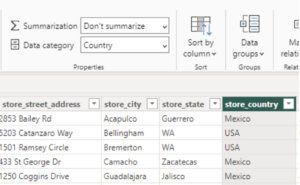
To start off with the first problem, let’s imagine our dataset containing North American sales from Canada, the United States and Mexico. In our table view of our data, we can see that we have individual columns for Country, State and City. Under the Column tools tab and the Properties pane, make sure to assign each column the correct Data Category (as you can see, the store_country field has a value of a geographic Country):
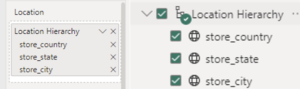
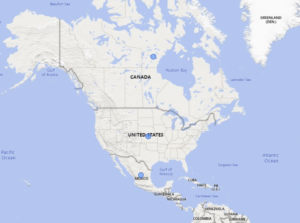
Next, in the Report View, it seems natural to make a location hierarchy to allow for drill down functionality on your visualization. After pulling that hierarchy onto the Location card (like in the top image below) in the visualization pane, we get visuals like the map below:
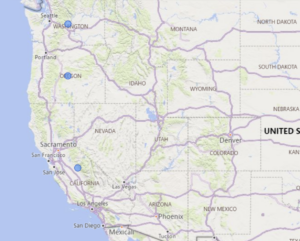
Looks normal right? After turning on drill-down in the top right corner of the visual, let’s click on the USA. We now see that we have sales in Washington, Oregon and California:
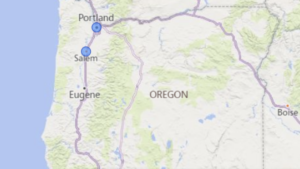
Say I want to view Oregon sales. Let’s click on Oregon. Again, everything looks normal and shows sales in the cities of Portland and Salem:
Let’s drill back up to the state level of the hierarchy where we see one dot in each of the three US States. This time, let us say we have the goal of seeing which cities across the US we have stores in, not exclusively in Oregon, so we would want to go from the state level of our hierarchy to display the city level. To do this, we hit this tiny button with two downward facing arrows in the top right corner. Doing that makes the map look like this:
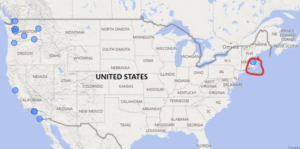
Now, we see all the cities in Washington, Oregon, California and Massachusetts?
After hovering over this strange point to see the tooltip, everything looks right:
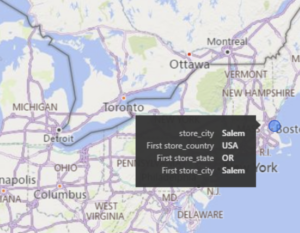
Despite still having the hierarchy (country, state and city) all still on the view, the map seems to be ignoring this and the level of detail of the map. It is mapping Salem, Massachusetts instead of Salem, Oregon. (Possibly because Oregon is the latter state if you line them up alphabetically.)
If we were to remake this map and visualization with the same data in Tableau using a hierarchy, Tableau automatically maps these points correctly:
Regardless, how do we fix this in Power BI?
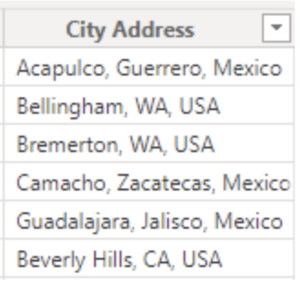
In essence, we need to put the address as the third level of the hierarchy beneath the country and state, instead of the city name. This trick seems to help Power BI recognize the level of detail for the city and map them correctly. To do this, the key is to make a new column in the format of “City, State, Country.” You might already have this, you might have to join/concatenate a few columns together, or split a full address column. Your final column should look like this:
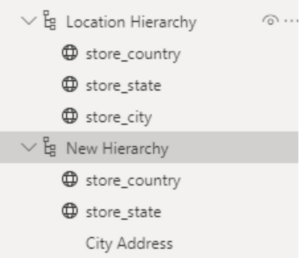
Go back to report view and create a new hierarchy. Instead of (Country > State > City), you should make it (Country > State > City Address). For comparison, here is the old one on top, the updated on the bottom:
In your visualization pane, replace the old hierarchy with the new hierarchy. Now, our map works correctly:
Issue one solved!
On to Issue Two
Although we solved problem one, lets look at a different issue. If we go down to the state level of hierarchy, why does Mexico City, Brazil plot in the middle of Brazil?
As you can see when we hover over, the Data has a state of DF inside Mexico, but the native Power BI mapping doesn’t seem to recognize this. Up until 2013, it was common to refer to Mexico City as “DF” from “Distrito Federal de México.” Since 2013, the abbreviation “CDMX” (Ciudad de México) has been more common, particularly in relation to government campaigns.
To fix this mapping error, we want to replace the values in our dataset from DF to either “CDMX” or “Mexico City” (think New York, New York.) To complete this simple fix, head back to your PowerQuery and transform your data! Highlight the state column containing the “DF” name and simply replace the values to “CDMX,” like you might’ve guessed! Do the same for your city address column, hit close and apply, head back to the report view, and bingo! Your map is now fixed:
Now, our visualization has correctly mapped locations, the ability to drill down and the ability to swap the level of hierarchy in the view while still keeping the level of detail for the other levels of the hierarchy!
If you have any questions, contact us here at InterWorks, and we would be happy to assist you and answer any questions you have with Power BI or the analytics industry. I hope this quick fix helped you!