Back with another blog post fast on the heels of #TCC2012!
Now that we’ve seen Christian’s and Chris’ amazing introduction to Tableau 8 in the TCC Keynote, here are some of the Tableau 8 elements the team and I are looking forward to. Overall, this looks to be an amazingly promising set of features that will literally help my clients as soon as they go live. So, here goes my top 10 – actually, I’m so excited that we’ll make this one go to 11.
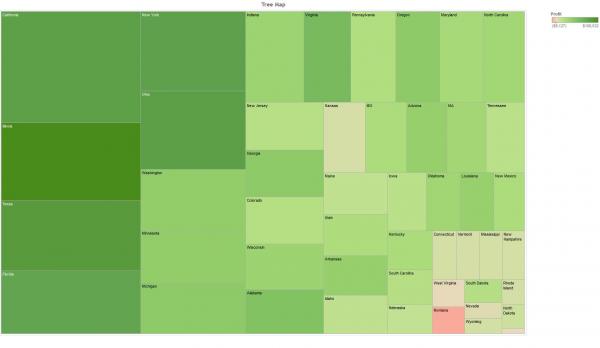
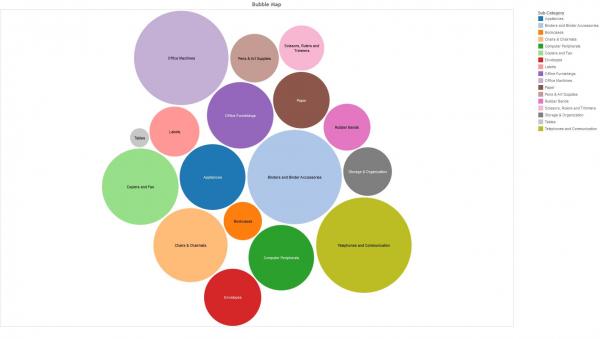
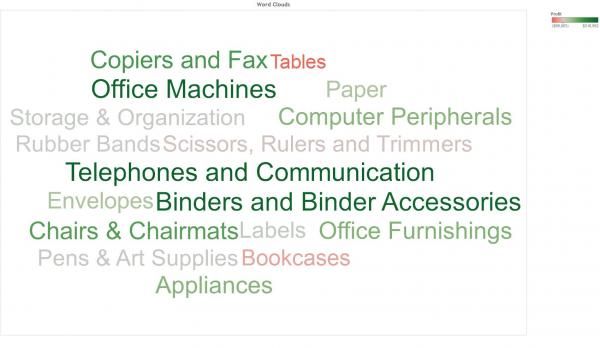
 11. New Visualizations – Tree Maps, Bubble Charts, and Word Clouds are all here, and with Show Me! they’re just as easy to build as every other visualization in Tableau.
10. New Connections – Native connections to both SalesForce and Google Analytics, and a new partnership with Google BigData. As Data Scientists, this is our currency, so I’ll take all I can get.
9. Redesigned Viz workspace – Improved card shelf and overall desktop environment makes for quicker design, more robust visualizations, and a smoother design process. And yes, there are coloured tabs along with different tabs for dashboards.
8. Blending Without a Linking Field in the View – Blending has long been one of the most amazing features of Tableau as it allows us to combine data from disperate sources – and now the big caveat to blending’s flexibility is wiped away. Not only that – we can now filter the blended source separately from the primary source!
7. Dashboard Level Filtering – We asked for it – we got it! There’s always been a usable workaround for this in Tableau 7, but this will be a great time saver. Ellie Fields from Tableau put up a great blog post highlighting this as well as other Community Idea based additions.
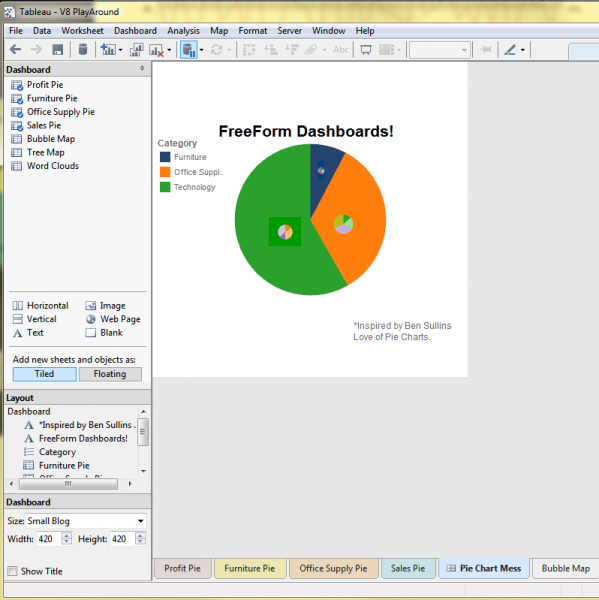
 6. Updated Dashboarding – Where to even start on this mini list? Freeform dashboarding allows for floating elements and non Cartesian layouts, an improved sizing and control system will aids precision placement and sizing of elements, and a brand new Layout box shows an interactive and comprehensive list of dashboard elements.
5. Parallel Dashboard Loads – In Tableau 7, dashboard components loaded serially, presumably to lighten load on the DB/Data Server. In Tableau 8, the entire dashboard will load in parallel, meaning that if you have 10*1s visualizations, your dashboard should load in around 1s-2s, rather than 10s-12s. This is big – it translates directly into FAST and should provide freedom and room for creative dashboarding.
4. Server Side/In-Browser Design – Long exclusively the purview of the Desktop product, now users of Server can edit and design visualizations in the Browser or on their Tablet. This really brings self-service BI to another level.
3. Parameters in Custom SQL – This has the geekier members of my team very excited – with the ability to parameterize Custom SQL, the sky is the limit when we’re designing efficient queries that maximize database potential while remaining flexible.
2. JavaScript API – Tableau Server 8 adds a Javascript API that will have the ability to push, and pull, data from the Tableau environment. With my web-development background, I’m very excited about this prospect – I predict that I’ll be using this with at least 25% of my clients by year’s end.
1. Completely redesigned backend – The Piece de Resistance – Tableau’s rewritten the core of the Desktop product to dramatically speed the basic interaction with data, calculation engine, and visual display process. Again, this should translate to faster Viz performance – something that I work on with every client.


