I haven’t had a ton of time to really dig into the new features of Tableau 9, but I did want to start playing with the new Level of Detail (LOD) calculations to see what they could do. The result is simple yet entertaining. The resulting viz can be found here as well as at the bottom of this post.
The Data
I stumbled across an article from the official Social Security website listing the top baby names from 2014. The site has data from as far back as 1879! Using import.io, I was able to quickly pull down data for the top 100 baby names for the last 101 years. The source can be found here.
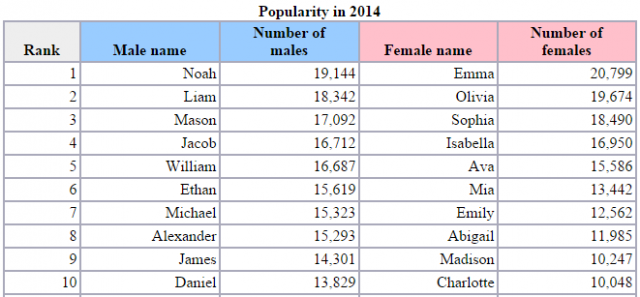
The resulting data came out (CSV) looking pretty similar to what is published on the website itself …

… but obviously a whole lot more data.
The Model
Before connecting to Tableau 9, I knew I needed to do a bit of reshaping. I could have attempted the model I wanted with the new built-in data reshaper functionality in Tableau 9 itself, but I like to find reasons to code in Python, so I did that instead.
The script is extremely simple and just moves some of the data around so Tableau can work with it more easily.
The code:
import xlrd, xlwt

book = xlrd.open_workbook("babyNames.xlsx")
new_book = xlwt.Workbook()
sh = new_book.add_sheet("babyNames_Tableau", cell_overwrite_ok=True)

rownum = 1

sh.write(0, 0, "Year")
sh.write(0, 1, "Gender")
sh.write(0, 2, "Rank")
sh.write(0, 3, "Name")
sh.write(0, 4, "Count")

for sheet in book.sheets():
	for rx in range(2, sheet.nrows):
	  for cx in range(0, sheet.ncols-3):
	    if cx >= 1:
	      sh.write(rownum, 0, sheet.name)
	      sh.write(rownum, 1, "Boy")
	      sh.write(rownum, 2, sheet.cell_value(rowx=rx, colx=0))
	      sh.write(rownum, 3, sheet.cell_value(rowx=rx, colx=1))
	      sh.write(rownum, 4, sheet.cell_value(rowx=rx, colx=2))
	      rownum += 1
	for rx in range(2, sheet.nrows):
	  for cx in range(0, sheet.ncols-3):
	    if cx >= 1:
	      sh.write(rownum, 0, sheet.name)
	      sh.write(rownum, 1, "Girl")
	      sh.write(rownum, 2, sheet.cell_value(rowx=rx, colx=0))
	      sh.write(rownum, 3, sheet.cell_value(rowx=rx, colx=3))
	      sh.write(rownum, 4, sheet.cell_value(rowx=rx, colx=4))
	      rownum += 1

new_book.save("babyNames_Tableau.xls")
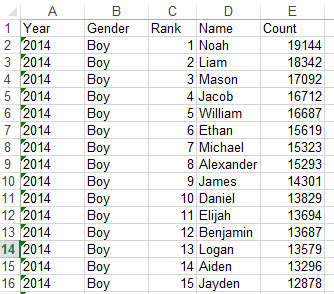
The resulting data looked like this:

Tableau LOD Fun
When first putting together the viz, I didn’t focus on trying to force LOD calcs into every pane. I simply wanted to see which, if any, LOD calculations would actually help with answering some data questions. To be honest, I only ended up actually publishing very simple fixed aggregation calculations. Amateur, but it got the job done.
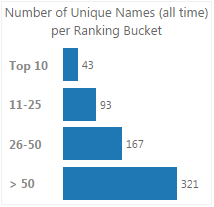
For example, the little pane on page one with the Number of Unique Names per Ranking Bucket required a simple two-argument fixed LOD calculation:


On page two, there are a couple more of these simple LOD calculations. Download the workbook at the bottom of this post to see how easy the calculations are!
The Viz
Click on the image below to interact with the viz:


