In my developer mind, what takes Tableau 8 from neat to amazing is the ability to manipulate, calculate and maneuver data quickly and easily.
Calculated fields allow you to compare fields, apply aggregations, apply logic, concatenate strings, convert dates or perform a myriad of other analytical and mathematical functions on your data without needing to make changes to your database at all. Calculated fields return a re-usable, drag-and-drop field into your Data window and the cache table. You can even calculate on top of your calculations. Amazing!
To take this functionality even further, Tableau allows you to do additional calculations on your data after Tableau has completed a query of the database. Table Calculations address data in the cache table and allow you to perform calculations on visible results.
So, what does that mean?
Once my visualization is rendered, I can ask Tableau to literally “look” at the results (numbers, bars, plots) and then do math on those visible results. Most importantly, unlike calculated fields that allow you to compare two or more separate measures in your data set, table calculations allow you to compare a singular measure to itself.
Here are five Tableau table calculation functions that will help me explain:
LOOKUP()
LOOKUP() is my favorite table calculation. This one very literally allows you to “look” at different results in your visualization. Using the context of the quick table calculations, Difference and Percent Difference, we can see how LOOKUP() is being used and how it works.
Difference

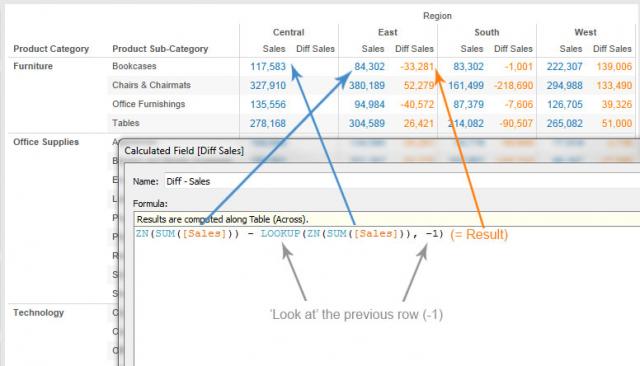
fig. 1 – Deconstructed view of a Difference quick table calculation (running Table Across).
In the Difference table calculation, we want to compare a value against itself in a previous (or simply, a different) partition. Notice how the second value in the calculation is wrapped in a LOOKUP() function, which “looks” at the previous partition’s value and then subtracts it from the next one, etc. The -1 declares which partition is in relation to the base of the calculation. Change the -1 to 1 or -2 to see the change in the result.
Percent Difference

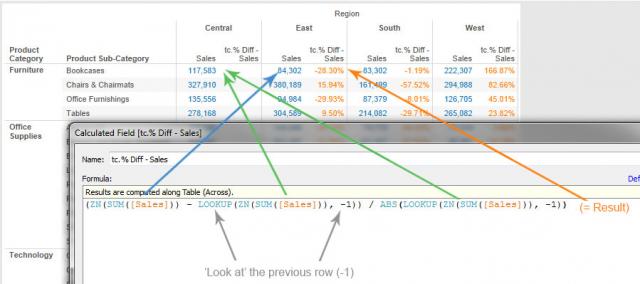
fig. 2 – Deconstructed view of a Percent Difference quick table calculation (running Table Across).
In Percent Difference, the LOOKUP() function is used in the same manner as in Difference. This one differs in the extra value in the equation, adding the denominator as the previous value. The logic is the same, however. The -1 argument tells Tableau to “look” at the previous partitions’ values.
Why I use LOOKUP() in every workbook:
LOOKUP() is extremely helpful as a filtering mechanism. By using the following table calculation, you can filter using a dimension without wrecking any other table calculations in your viz:
LOOKUP(MIN([Your_Dimension]), 0)
The table calculation “looks” at each row and labels it with its MIN value. Seems like nonsense, but this is incredibly, though passively, powerful. More on this in a future post.
TOTAL()
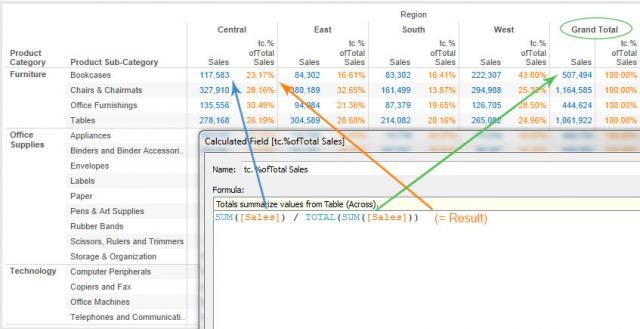
TOTAL(), though still acting upon a database calculation, is a table calculation that, like WINDOW_SUM(), simply adds all visible results along the direction and scope assigned. An easy example of TOTAL() can be found in the quick table calculation, Percent of Total.

fig. 3 – Deconstructed view of a Percent of Total quick table calculation (running Table Across).
This is very straightforward, though still helpful in explaining how Tableau table calculations work.
For a great explanation on the differences between TOTAL() and WINDOW_SUM(), check out this link: http://community.tableausoftware.com/docs/DOC-5640
ROW COUNTERS
I include the row counter table calculation functions in every workbook, and I do it for many reasons.
INDEX() or RANK()
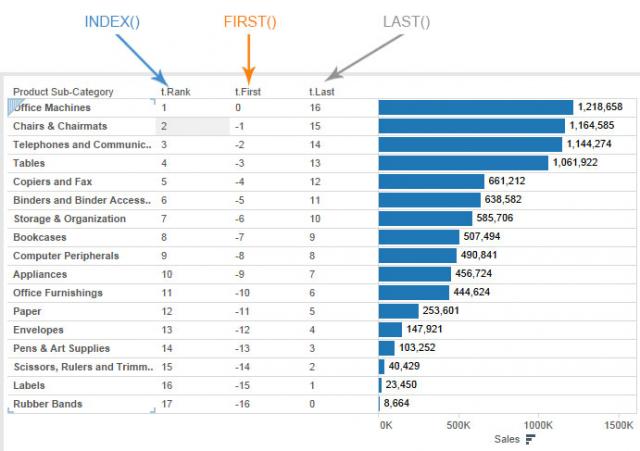
These two functions provide a unique incremental number for every row or partition assigned in the scope and direction of the table calculation. Basically, this table calculation will give you a rank field for every row or pane you can see in your viz. The RANK() function has additional functionality allowing for addressing ties and other groupings based on rank.
FIRST()
This function returns a 0 for the first visible row and then negative incremental numbers for the following rows or partitions.
LAST()
This function, obviously the opposite of FIRST(), returns a 0 for the last visible row and then positive incremental numbers for the subsequent rows.

fig. 4 – Deconstructed view of INDEX(), FIRST(), and LAST() table calculation functions (running Table Down), sorted Descending by Sales.
What makes these very simply functions so powerful? The row-counting functions can be leveraged in filters when your viz includes other table calculations.
Conclusion
There are many, many more table calculations and functions within the powerhouse of Tableau. However, by deconstructing and seeing how these five table calculation functions actually work, I now understand the machinery behind the scenes and can more quickly utilize more advanced features in my Tableau vizzes.
Remember, the only way to compare a measure against itself is to use table calculations. Don’t hesitate to understand this powerful feature in Tableau. You’ll use it more often than you think.

