Tableau Extended takes topics from Tableau Desktop training courses and expands upon those lessons for advanced functionality and use cases.
From the very beginning of our Tableau journey, we use the Data Connection Page to connect to data sources and even modify the data connection for additional combinations of information. In this article from the Tableau Extended series, I’m going to fully introduce the Data Connection Page and all of the great features available here.
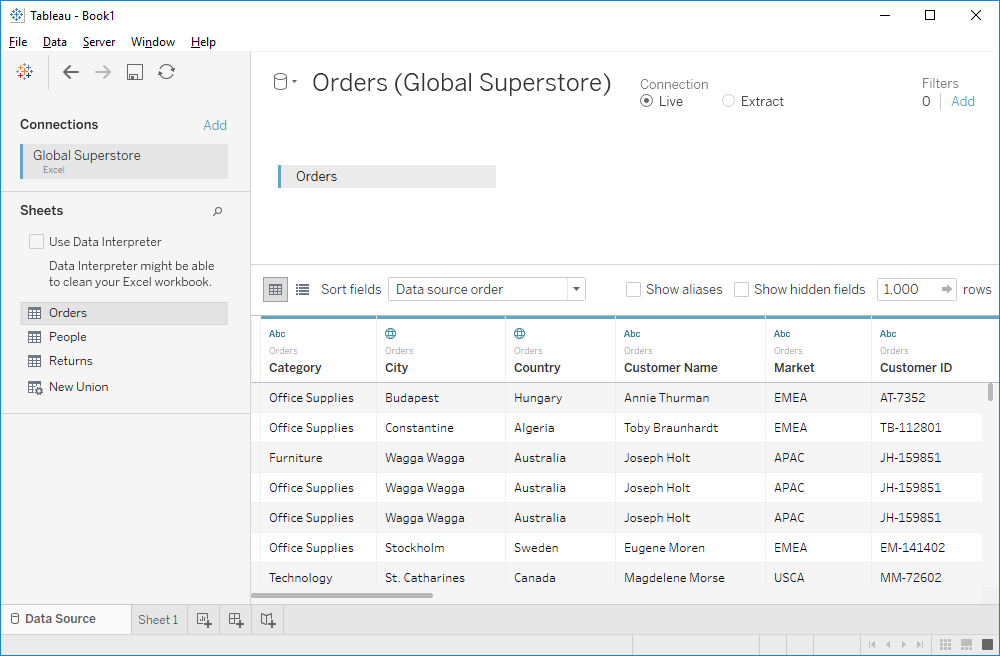
Connections
Let’s start with the data connection itself:

Beneath the Connections header, you’ll see the title of the data source (i.e. Global Superstore) as well as the type of data connection (i.e. Excel). Tableau adds a color to the data source, as well. In this instance, it’s blue. If I added another data source, each would be assigned a different color (orange, then green, then red, then turquoise and so on). The same color scheme will be used in the Data Preview and Metadata Grid to identify the data source of each field.
Remember, the Connections area does not list out all of the data sources for the entire workbook. This is a common mistake made by new Tableau Desktop users. Instead, it’s just the data sources that are going to be used within this particular data connection. The ADD button positioned here is solely intended to bring in additional data sources purely for cross-database joins.
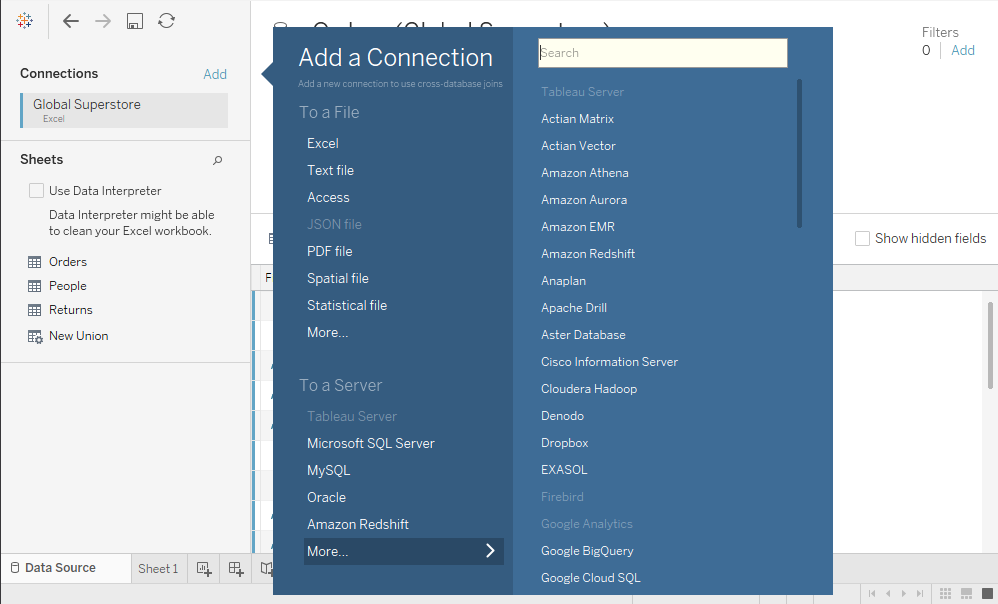
Right-clicking on a data source here offers three options: Edit Connection, Remove or Rename.
If Tableau is reporting that there is an error with your data connection, try using the Edit Connection option to reset the connection. You’ll use this most often when you’re working out of a Tableau Packaged Workbook (TWBX) and the local copy of the data source has become corrupted for whatever reason.
Sheets/Tables
Once we have a connection, Tableau will display the sheets available within the data connection. If you only have a single table or sheet within your data connection, Tableau Desktop will automatically select that sheet. If there are more than one, like our example from Global Superstore below, then Tableau will wait for you to choose which sheet or table you want to use for your data connection.
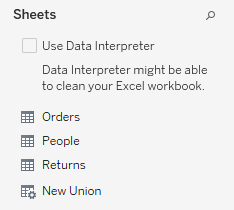
Drag any table over to the Drag Sheets Here section of your Data Connection Page to connect to a specific table or sheet. When you do, there will be a slight delay as Tableau algorithmically processes the fields and the data within this table. It will make decisions on the data type, geographic roles, dimensions vs. measure and more.
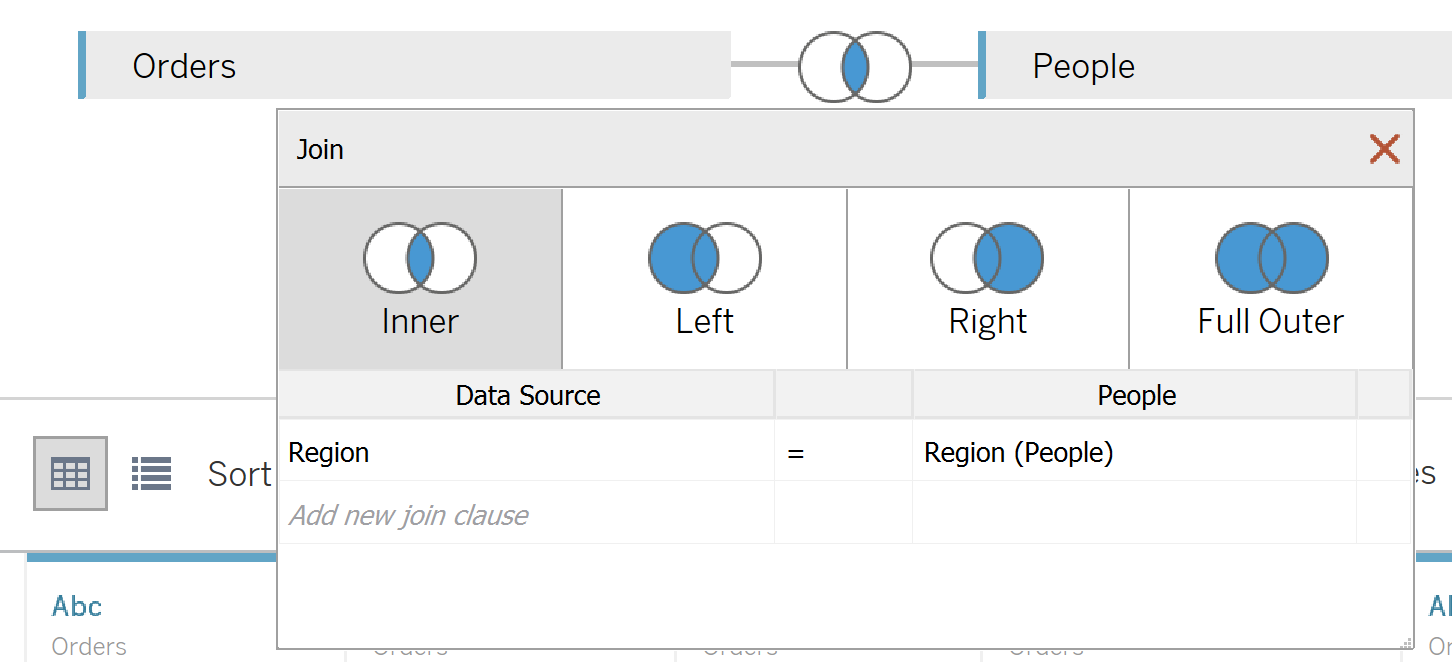
You can also bring over additional tables to create a join:
Let’s go back to our list of tables or sheets. If you hover your mouse cursor over any of the tables or sheets, then there’s an option to preview the data:

There are a couple of other features tucked into this area. The Data Interpreter is available to help fix common errors in Excel workbooks to transform it into a more ideal format for Tableau Desktop. We’ll address the Data Interpreter in more detail in a subsequent article in the Tableau Extended series.
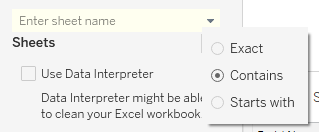
The last feature is the little magnifying glass, which allows you to search your sheets or tables. This is helpful if you have a data source with a lot of sheets or tables inside of it.

In addition, there is a down arrow at the end of the search input that allows you to select how your search term is utilized:
Connect Name

At the top center of the Data Connection Page is the name of your data connection. Tableau Desktop will default to the name of your data source with the sheet name in parenthesis. The default name will change if you create more complex connections, such as joins and blends. You can simply click on the title to rename of the data connection.
Next to the data source icon (i.e. the cylinder) is a down arrow. This allows you to select any data connection in the workbook or to create a new data connection. Remember, the Data Connection Page shows the detail on a particular data connection rather than all data connections all at once.

The shortcut to create a new data connection is CTRL + D.
Connection Type
Next to the name of the connection is the type of connection Tableau Desktop has to the data source. There are two options here: Live or Extract.

By default, Tableau will use a live connection to the data source. Keep in mind that a TWBX creates a local copy of the data source as a packaged workbook even if it says live connection. A packaged workbook contains everything needed to work in Tableau, including the data, into a compressed file format.

The extract option allows you create a subset of the data. Next to the extract radio button is the Edit button, which contains all of your extract options. Within the extract options, you can aggregate data, filter the data and even remove fields. The extract is created as a TDE file – a tabular data sheet optimized for Tableau’s Data Engine. Tableau extracts are a great option to optimize performance where the bottleneck is the upstream data source.
You can also create an extract directly from your Data pane on the worksheet page by right-clicking on the data source that you want to extract.
Filters
In Tableau’s Order of Operations, extract filters occur first. They are the first queries that are executed from the data connection. The next operation performed in the query pipeline are workbook filters. These appear in the top, right-hand corner of the Data Connection Page:

Any filters applied here, will filter this data connection for the entire workbook. When you click the Add option, you’ll see a summary list of all of the workbook-level filters for this data connection:
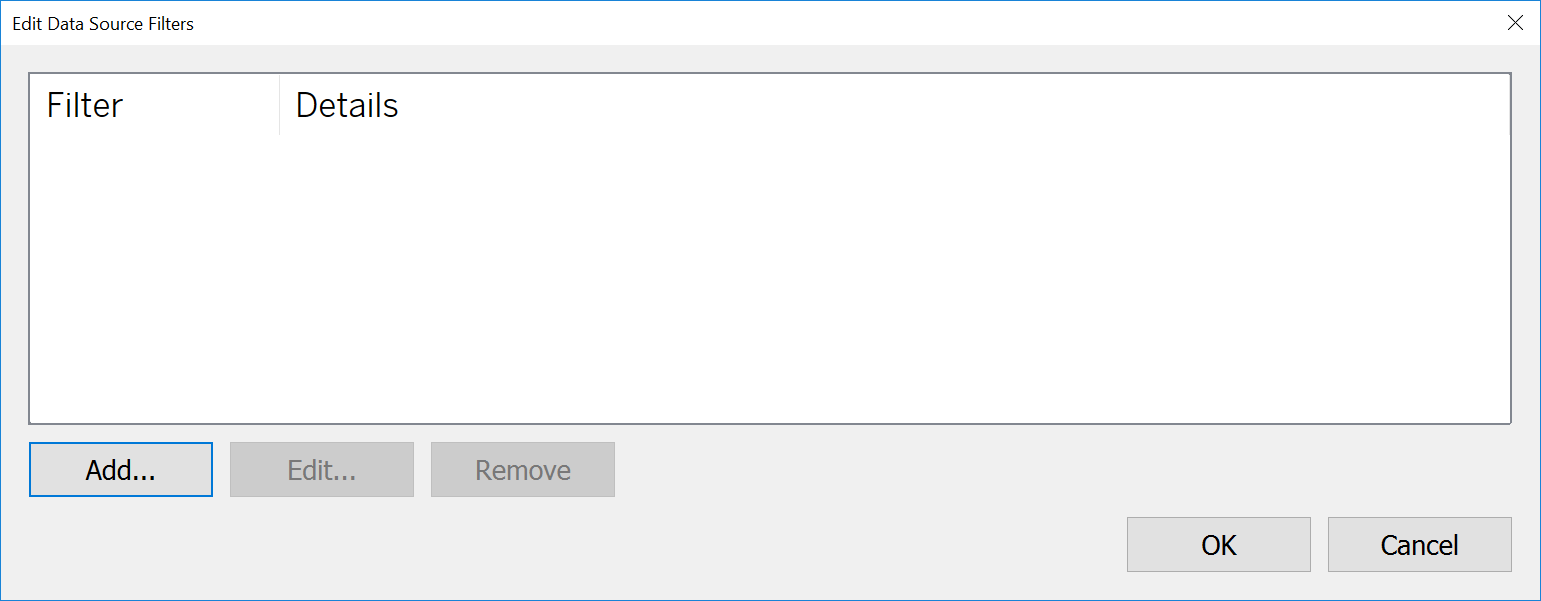
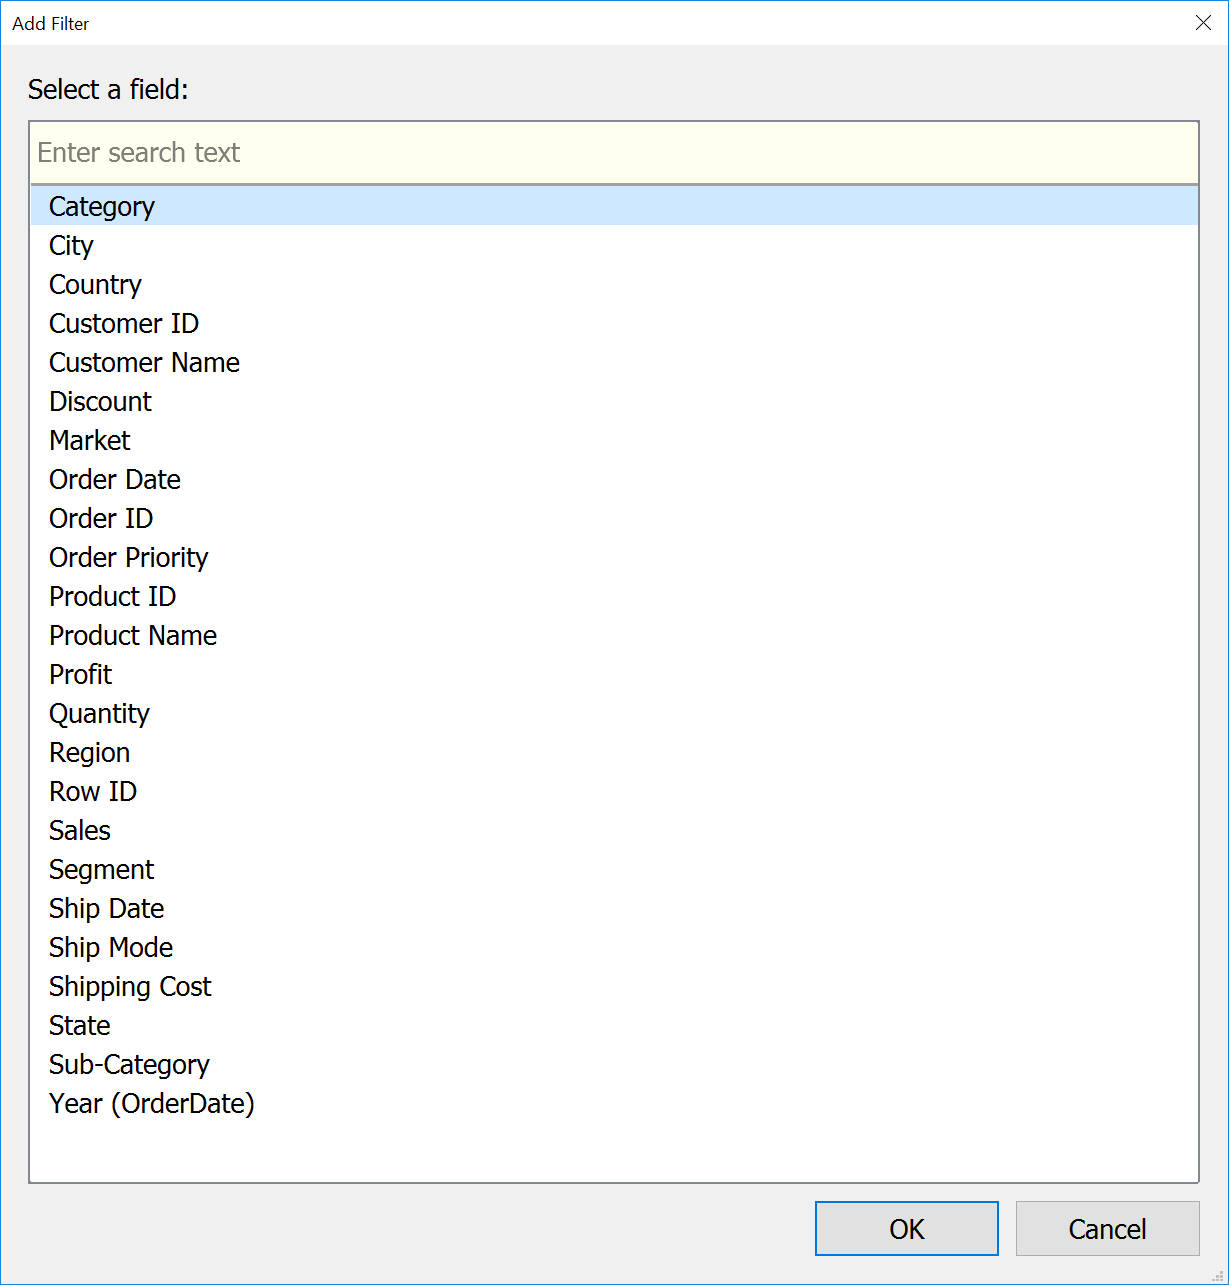
The Add button at the bottom will show a list of fields in the data connection to use as a filter. They otherwise act like normal filters, either discrete or continuous.
Data Preview
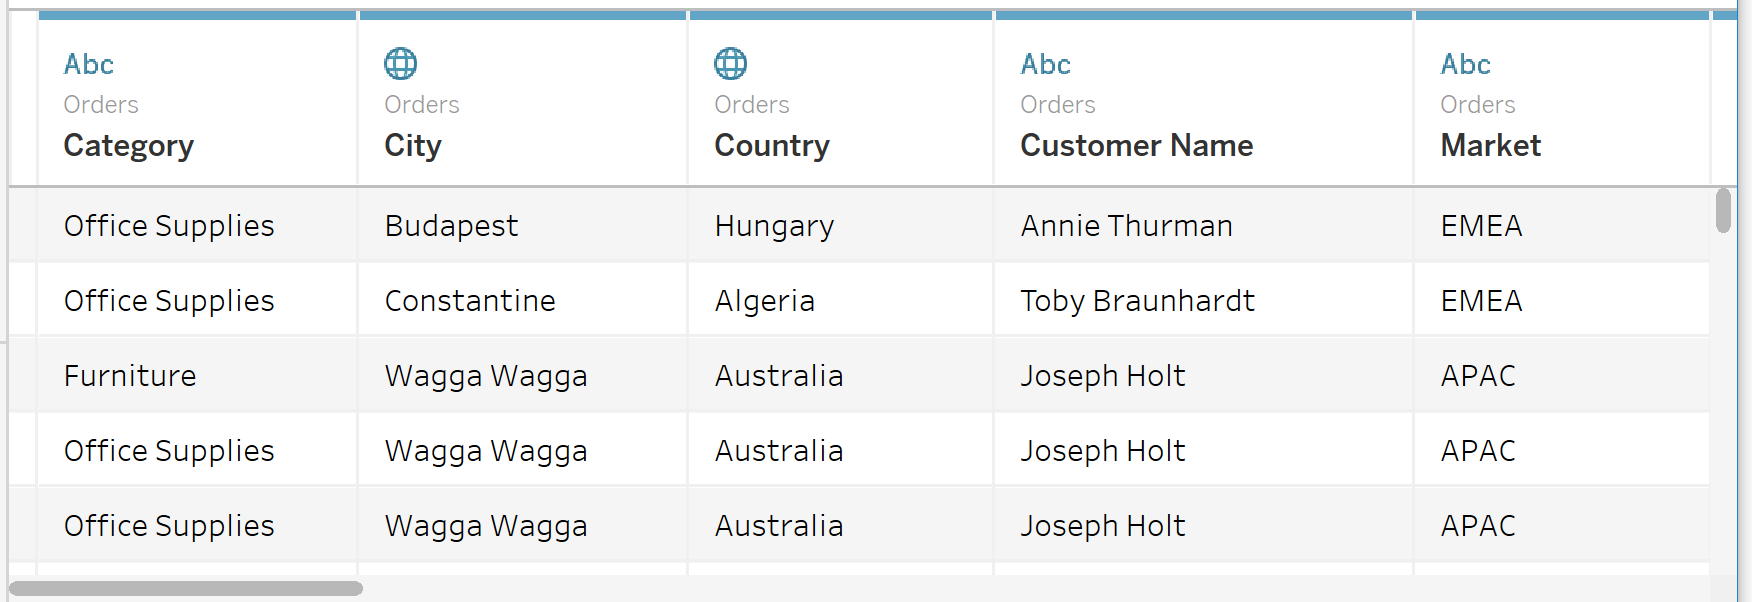
The bottom half of the Data Connection Page has a couple of options to display. The default is the Data Preview:

The Data Preview option allows you to see sample data for all of the fields in your data connection. The fields will be presented with their data type, originating sheet or table and the field name. The fields are also colored by their originating data connection in the case of a cross-database join.
From the Data Preview, you can also make any metadata changes that are needed. You can control how you want to sort your data and whether you want to see aliases for your data, hidden fields and how many rows to preview.

Metadata Grid
The second option for the lower half of the Data Connection Page is the Metadata Grid. This is a more concise way to view your fields without data, so you can manage their properties more succinctly.
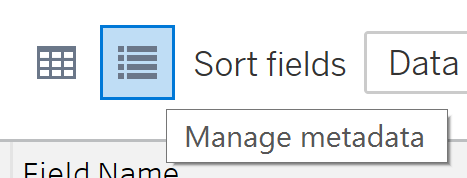
Rather than seeing your fields side by side, the metadata grid stacks them:
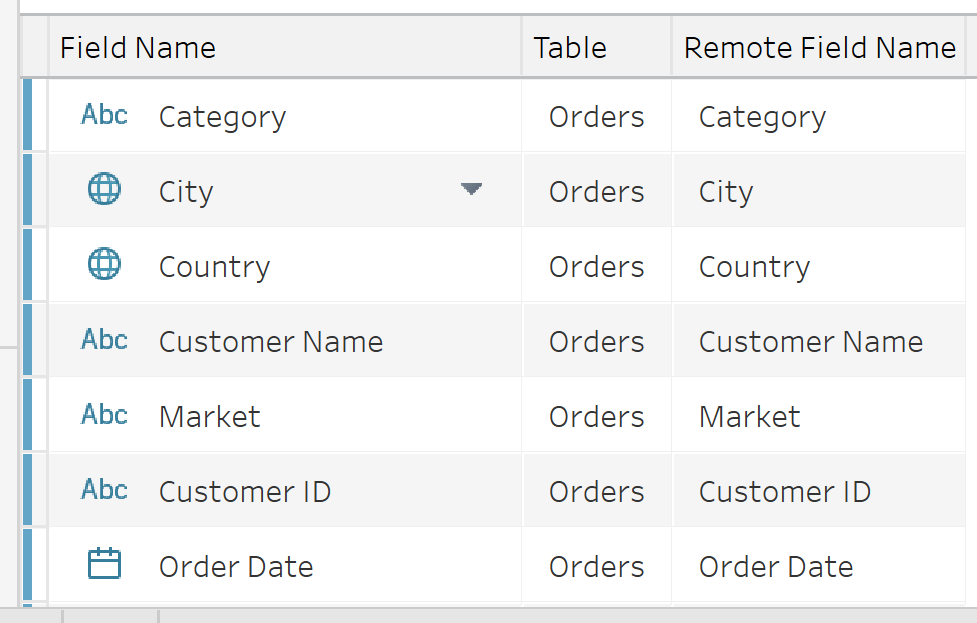
This is an easier view to modify your metadata. Data is the information within the field whereas metadata is the information about the field. These are attributes like the field name, the data type, the number format, default colors, groups, etc. Metadata is stored within the TDS file. Learn more on Tableau 10 File Extensions.
What’s Next?
We’re going to spend the next few articles on the Data Connection Page, focusing on how to pivot fields in the next article and then followed by a closer look at the Data Interpreter. Make sure to leave your questions or thoughts in the comments section below.
Thanks, and Happy Tableau-ing!

