
Table calculations are one of the hardest functions to understand in Tableau Desktop. A lot of us are guilty of clicking through every single option on the table calculation window until we find something that looks right. There is a lot of great material out there to help polish up your table calculations, so I’ll hold off on doing another Deep Dive (for now).
Instead, let’s talk about window functions, more commonly known as moving calculations. I’ve also included all the charts we’ll build at the bottom of this article in a packaged workbook available for you to download.
What Are Moving Calculations?
Let’s compare a moving calculation to a running total. A running total starts somewhere, most likely the first value, and then totals each subsequent by some type of aggregation (i.e. sum, avg, min, max, etc). A running total table calculation will continue until the end, determined by the scope and direction of the table calculation. If your scope and direction is table (down), then your running total is going to include all values in that particular column.
A moving calculation uses a window around the data point where the table calculation is currently active. The window is defined by previous values, next values and the current value. Let’s look at the following table:
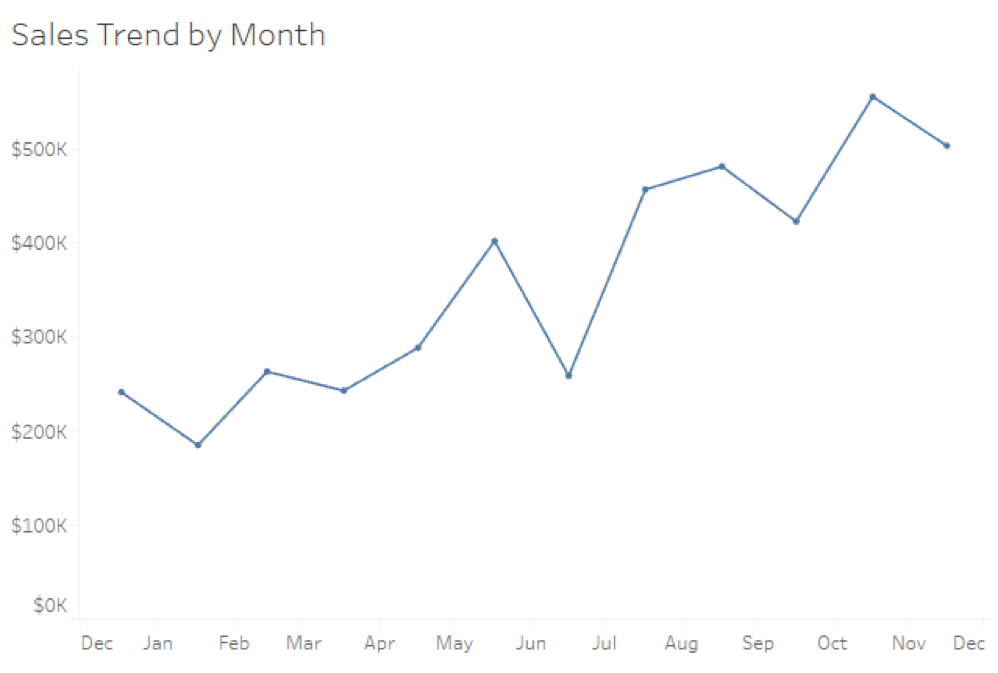
You can see above we have a line graph showing Sum of Sales by the date value of each month along a continuous axis. Let’s do a sample moving calculation on a particular month on our timeline; we’ll use June 2015. We first must define the size of our window around this data point. I want the previous three months, the next two months and the current value.
Here’s what my window will look like behind the scenes for Tableau to make the calculation:
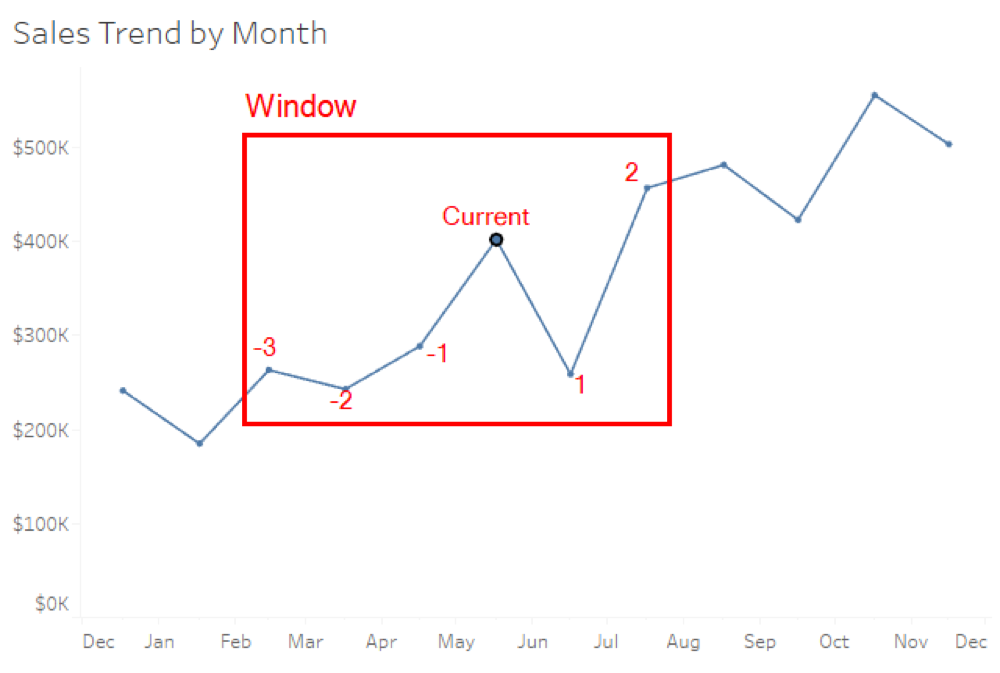
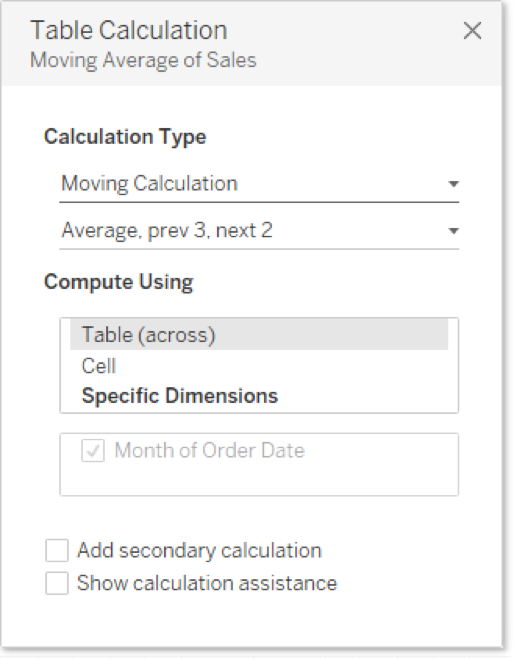
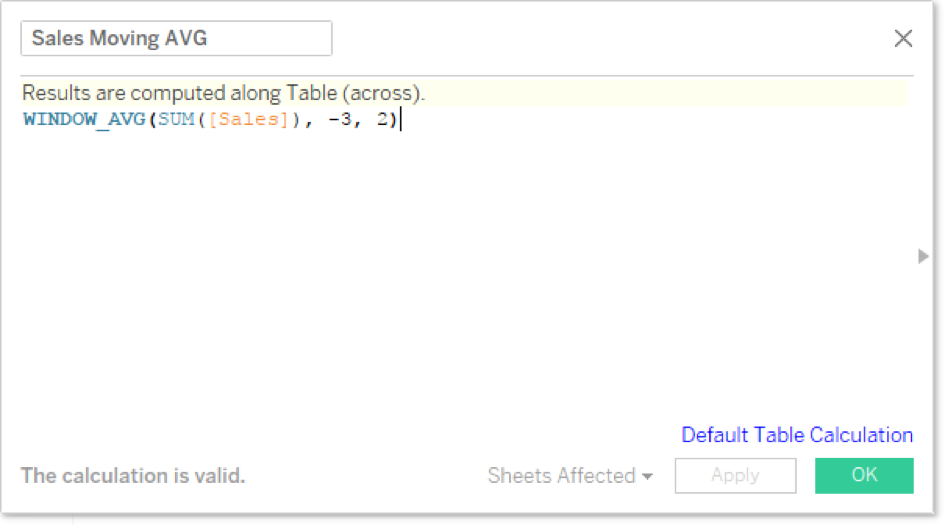
Tableau will build this window on every single data point and create a window function within this set of values. If we decide to use a moving average, then we might build it in the table calculation editor like this:
You can see below how Sum of Sales with a table calculation would compare to sum of sales without it.
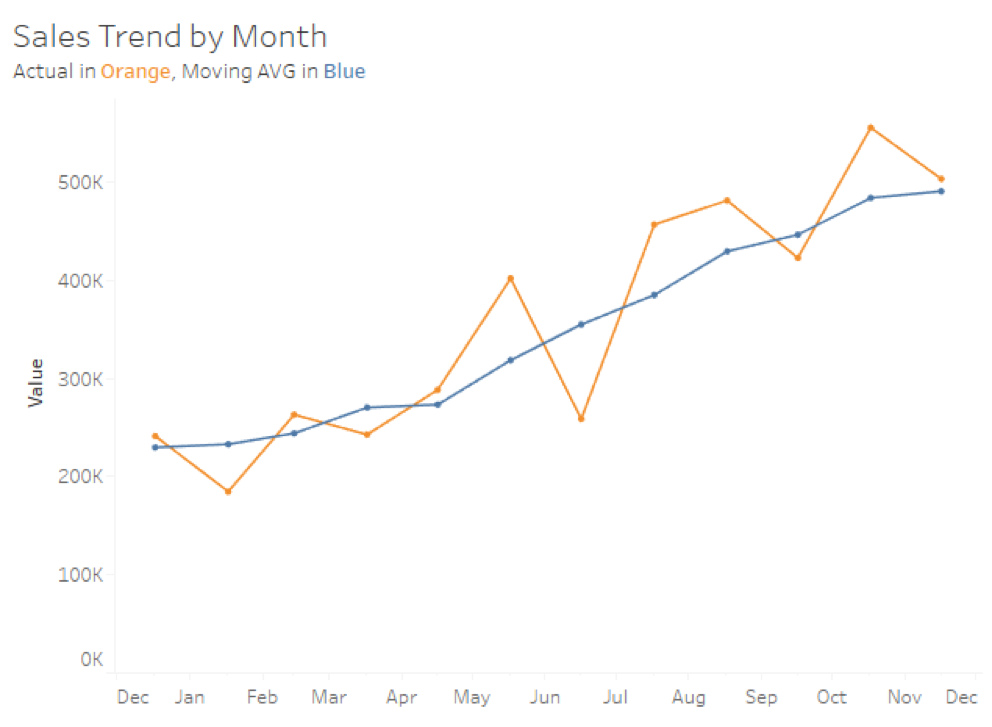
The chart above helps us see last year’s trends without the confusing peaks and values of month to month variance. Pretty useful, right?
Calculated Field Editor
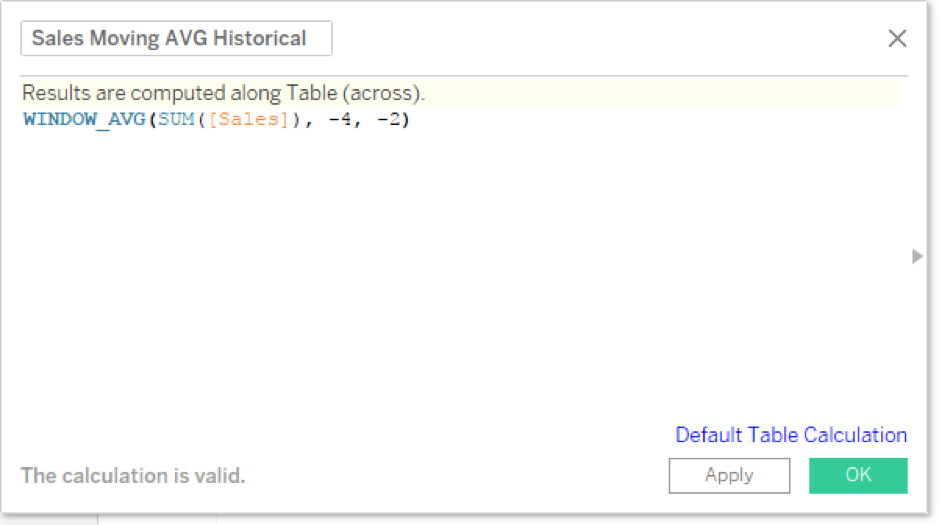
The same moving average that we constructed above looks like this in the calculated field editor:
I don’t have to recreate this table calculation by guessing either. I’ll simply grab Sales with the table calculation on it and drag it to the Data pane, just like saving an ad hoc calculation.
Notice the WINDOW_AVG function is in bold. That lets us visualize how the function is happening locally on the temporary table that Tableau builds once the VizQL query returns from the data source. My previous three values are represented by a -3 and the next values by 2.
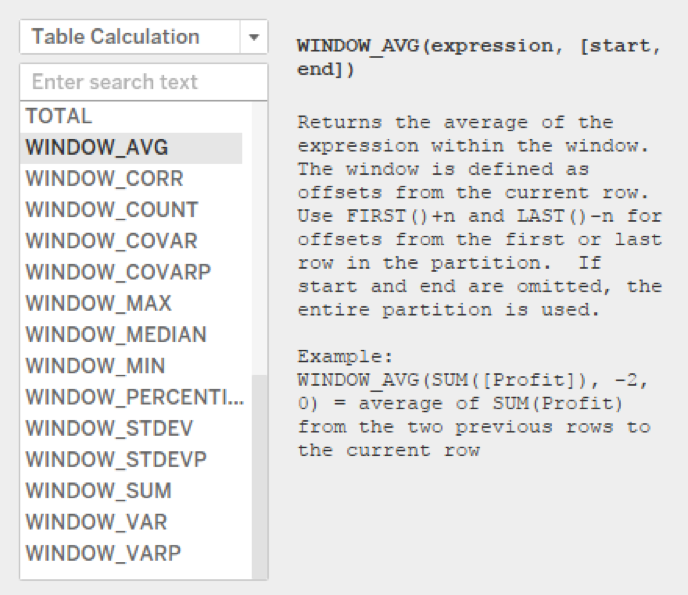
The calculated field editor in the function help section has a complete list of our window functions:
Now that we’ve defined moving calculations and why they use window functions to work, let’s have some fun.
Using Parameters
Parameters have a lot of different use cases, which I detailed in my Deep Dive on Parameters series. We can use them in table calculations if we first save them as calculated fields. I’ll start by building a parameter. Here are my selections:

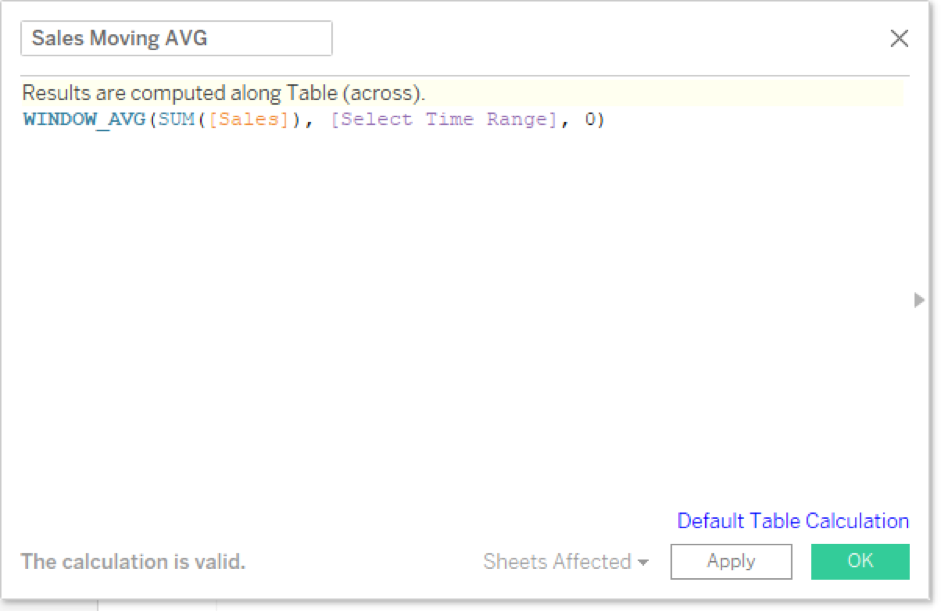
Notice I’ve made my numbers negative, because I want to use them as previous values in my window function. I’m going to fix my moving average to parameterize my historical selections. I’ll set the next values to 0 and keep the current value in the window. Here’s the revised calculation:
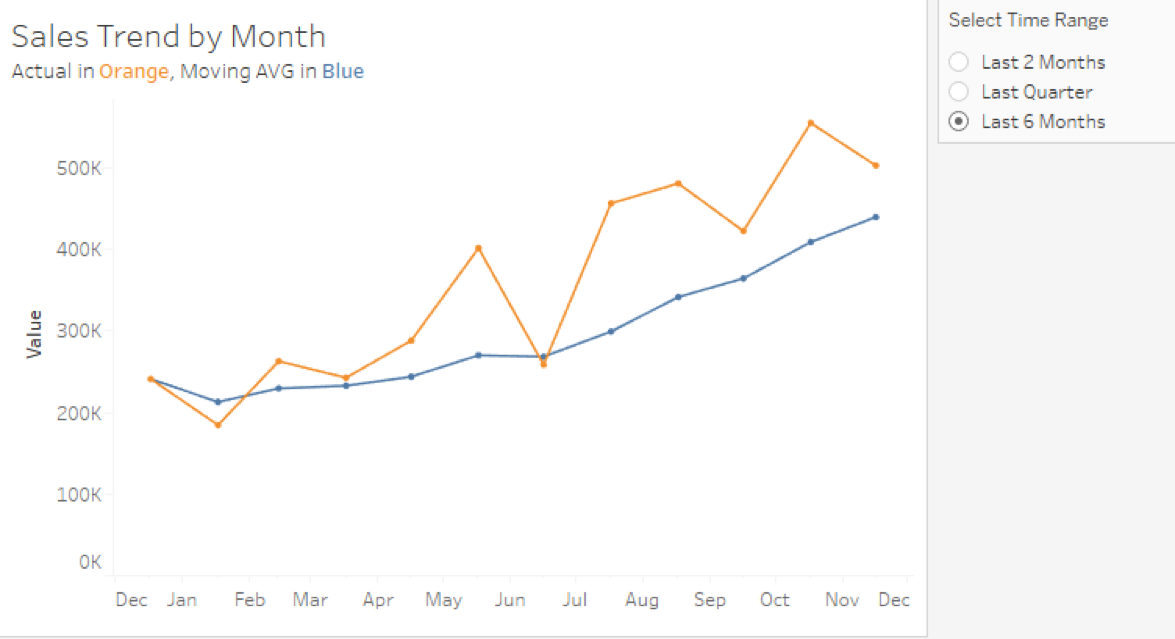
And here’s our new viz:
Historical Date Ranges
While our table calculation editor asks us for previous values and next values, we don’t have to comply with that request. What the previous and next values are really doing is defining the range. We can enter in any numbers we want, including two negative values. Let’s say I want to calculate the moving average on a period of three months but trail one full month behind the current.
My calculated field would look like this as a result:
The above calculation would create the following window on each data point:
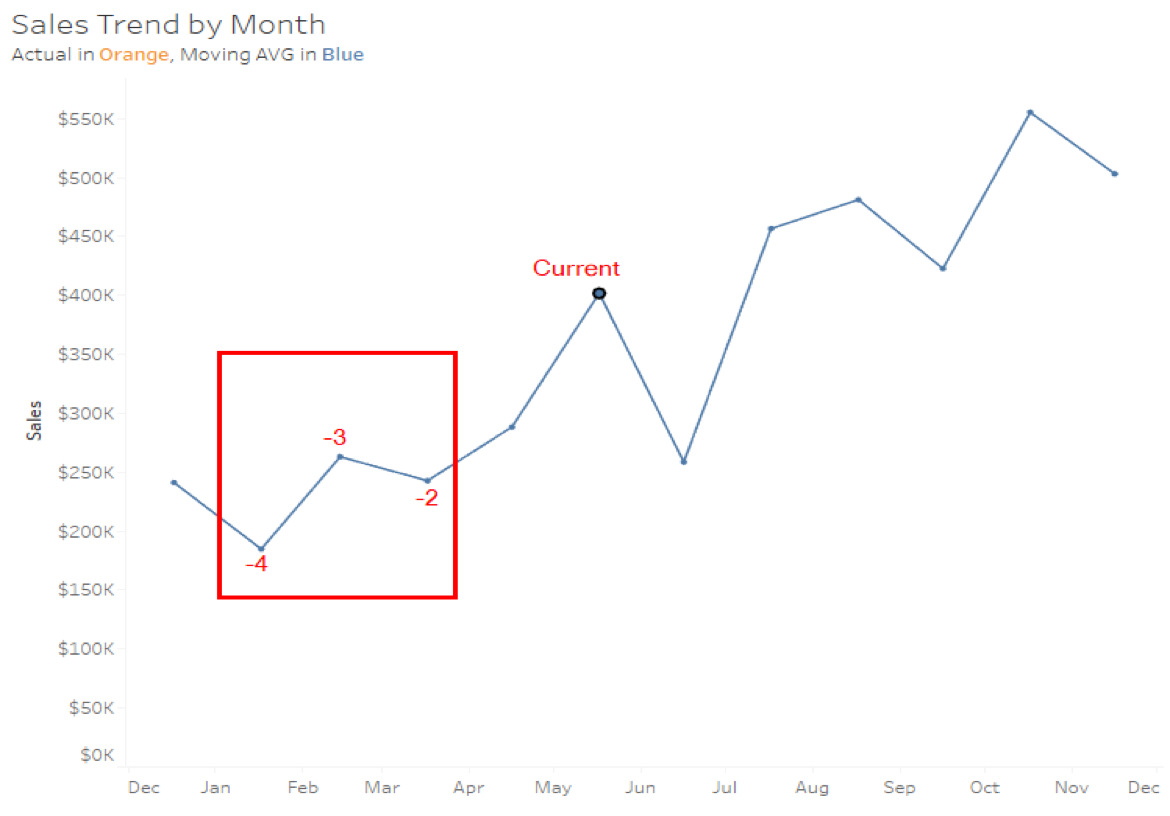
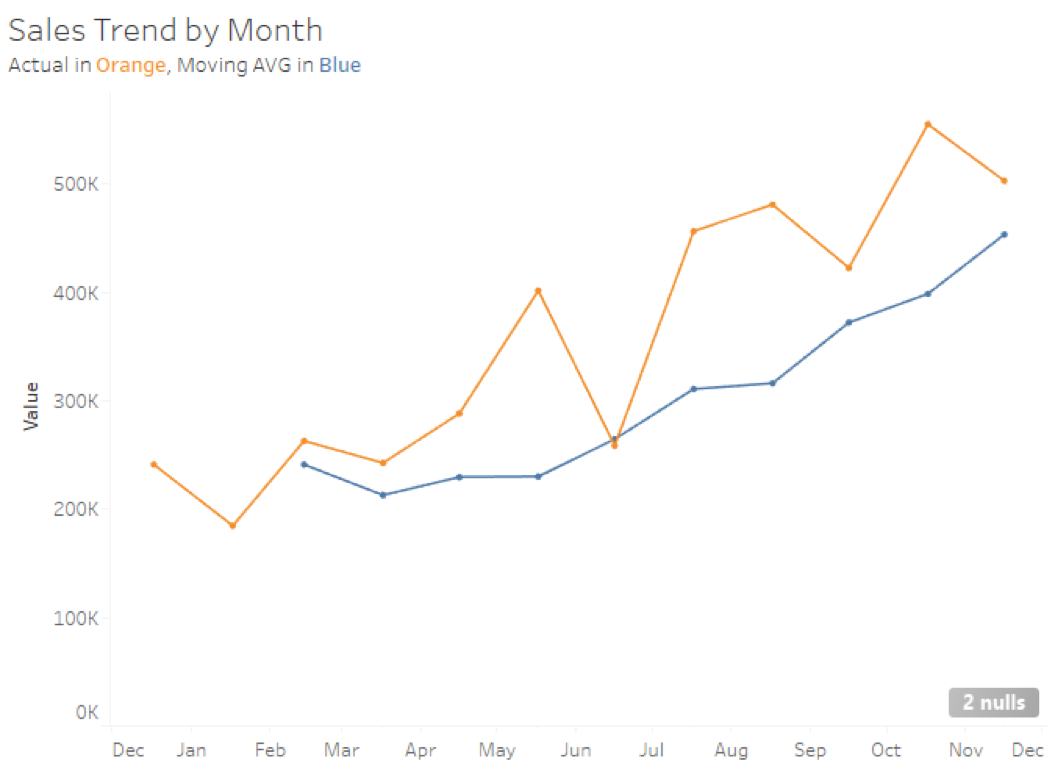
And our line graph would look like this:
Excelsior!
By the way, nulls are to be expected with certain types of table calculations. For line graphs, its probably best to right-click and ignore the nulls rather than filter or set them to the default value of zero. Honestly, it’s a case by case basis on what you’re trying to visualize.
Using Date Parts
Now, let’s get even more complex. The following use case was put forward to me by a student named Jim in one of my DI/DII Accelerated classes in Perth, Australia. He wanted to calculate a moving average on a previous business week. So, if the current value was calculating on a Wednesday, Jim wanted the moving average to calculate the previous full week from Sunday to Saturday.
We’ll need to use date functions and our knowledge of date parts to make this work. I also did a Deep Dive on Dates if you’d like more information on this topic. Let’s start with our previous value calculation. I need to use three different date functions:
- DATEADD: I need to subtract one week from my Order Date to get back to the previous week.
- DATETRUNC: I need to truncate my date to the start of the week, Sunday.
- DATEDIFF: Now, I need to calculate the difference between the previous week’s start with the current date.
Now, I need to aggregate this number so that I don’t have mismatched aggregations in my Moving Average and use INT() to change the data type to a whole number verses a decimal. My final calculation will look like this:
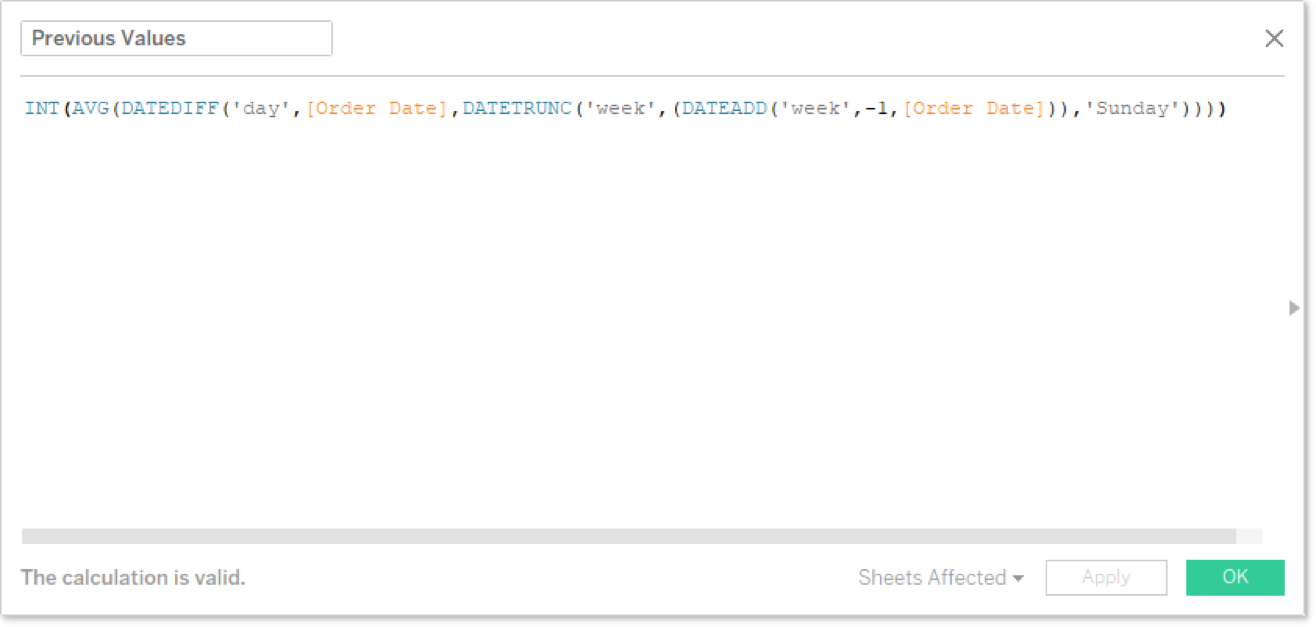
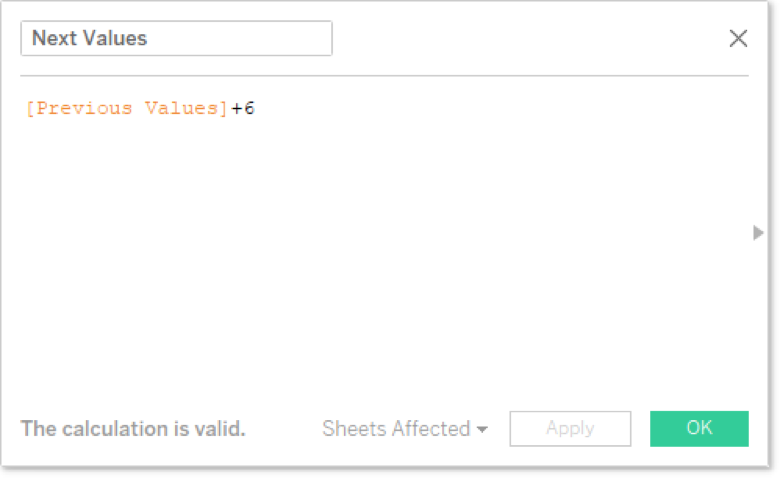
Notice I’m intentionally putting the earlier date second in the DATEDIFF function so that I get a negative result to fit with my window function. Calculating my next value (or the end of my range) is relatively simple now that I’ve done the hard work. I just need to add six days to complete the range for Saturday of the previous week:
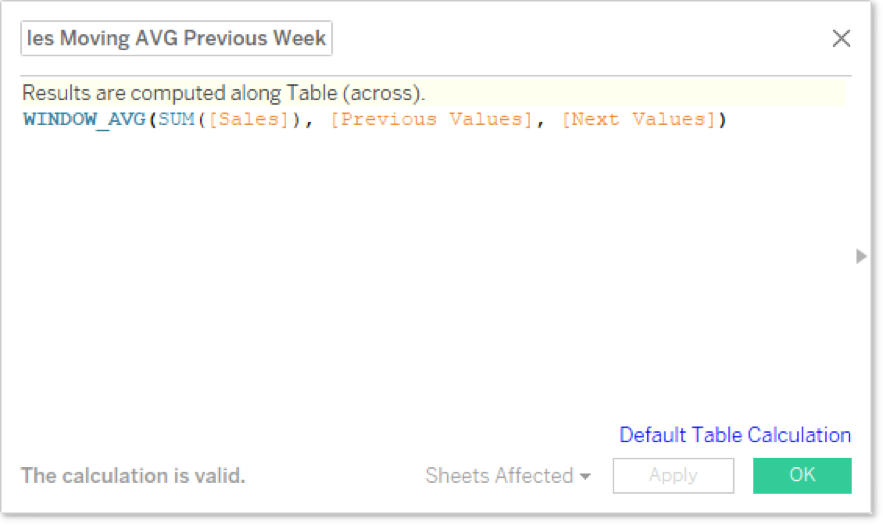
Put both of these into our moving average calculation for Sum of Sales to show a date value of the week on a continuous axis.
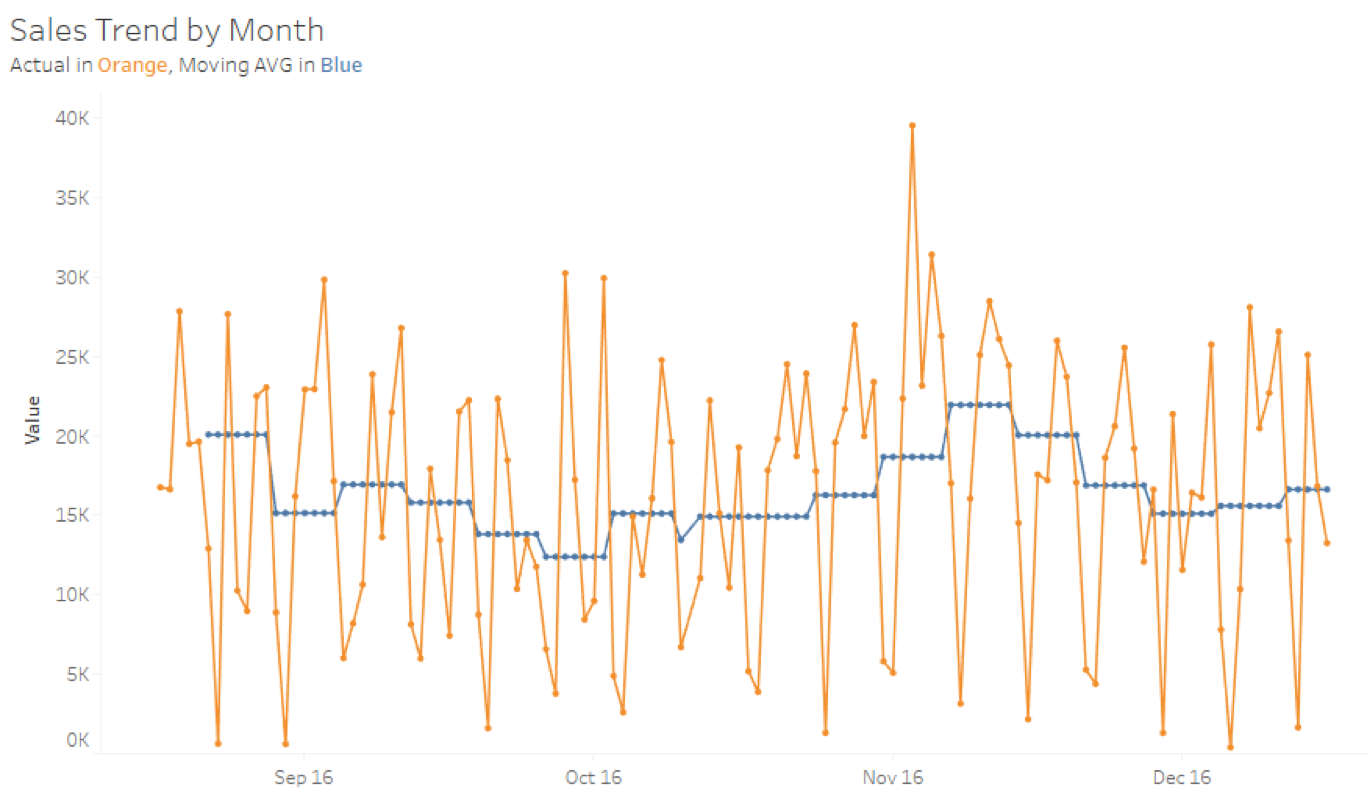
And finally, here’s what my visualization looks like with my new moving average for the last quarter of 2015 to the date value of day on a continuous axis compared to Sales:
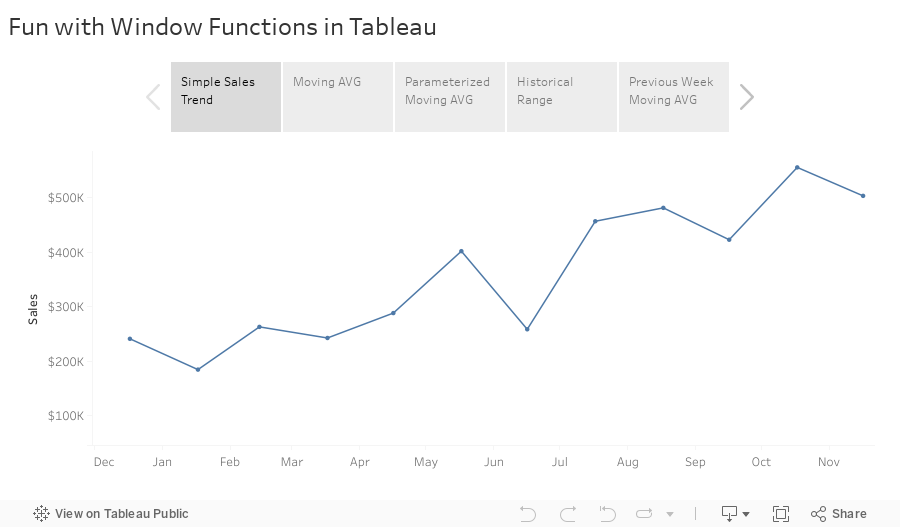
Thanks, Jim, for the fun idea. Here’s all our work from the use cases above in a packaged workbook on Tableau Public. Enjoy!
What’s Next?
Don’t forget to search the InterWorks blog for all kinds of goodness on table calculations. There are some real gems on here. Also, I’d love to hear from you in the comments section below.