
I’ve just returned from Vietnam, and I’d like to share a story with you. This story involves hundreds of people from countries all over the world, working together for a common cause.
First, let’s talk about a very common, little pest known as the aedes aegypti.
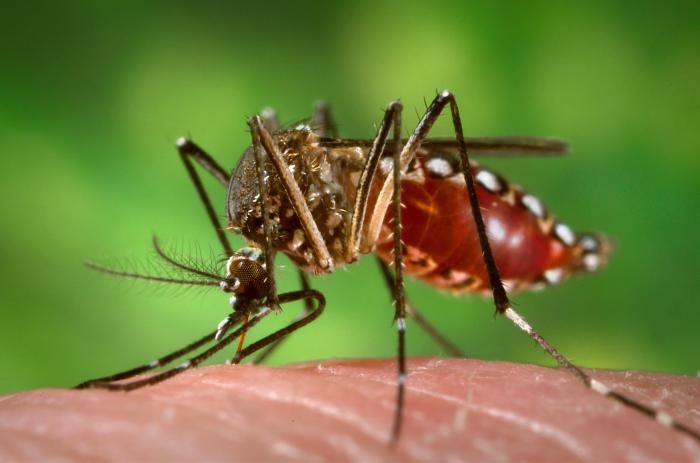
Aedes Aegypti
The aedes aegypti is a type of mosquito that originated in Africa, but can now be found in nearly every country in the world. They prefer hot and warm climates. As such, they are most prevalent in tropical countries. The reason this particular mosquito is important is that it is a carrier of several different types of devastating diseases, such as yellow fever, dengue fever and, most recently, the Zika virus.
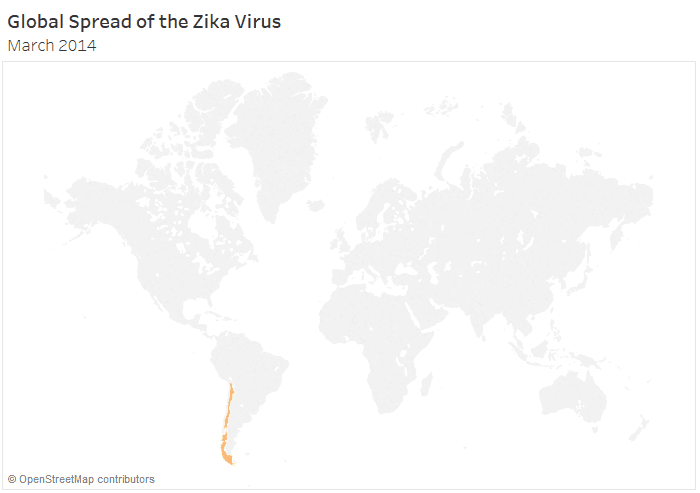
Starting in 2015, the Zika virus became a global epidemic. The Zika virus is difficult to diagnose and contain as only one in five of those that contract the virus show the typical symptoms. It has been spread unknowingly by tourists and travelers to Europe, North America and all throughout Oceania. The true insidiousness of this virus is how it impacts unborn children, causing microcephaly. These babies born with smaller than normal heads often suffer from intellectual disorders and more.
In this type of outbreak, a global pandemic, understanding the virus is critical. Where is it spreading? Who is at the greatest risk? How can it be contained? How can it be treated? Quite simply, data is essential.
A Partnership
The Center for Disease Control & Prevention (CDC) had a simple but profound idea.
Could data analytics be used to save lives? Specifically, could data visualization provide the insight needed to stop the spread of the Zika virus and other health emergencies? To help bring this idea to reality, the CDC enlisted the assistance of PATH. PATH is a Seattle-based organization that drives transformative innovation in global health.
My company, InterWorks, partnered with the Tableau Foundation to work with PATH’s project to support the Global Health Security Agenda in Vietnam, funded by the CDC for this purpose. The country where we’d implement the effort was Vietnam. Already, the Zika virus was appearing in the country. The worry was that Vietnam had a perfect mix of conditions for the Zika virus to explode. Dengue fever, also carried by the aedes aegypti mosquito, has already reached epidemic levels in Vietnam with nearly 50,000 cases just in 2016.
The goal was to use data intelligence to battle these health emergencies.
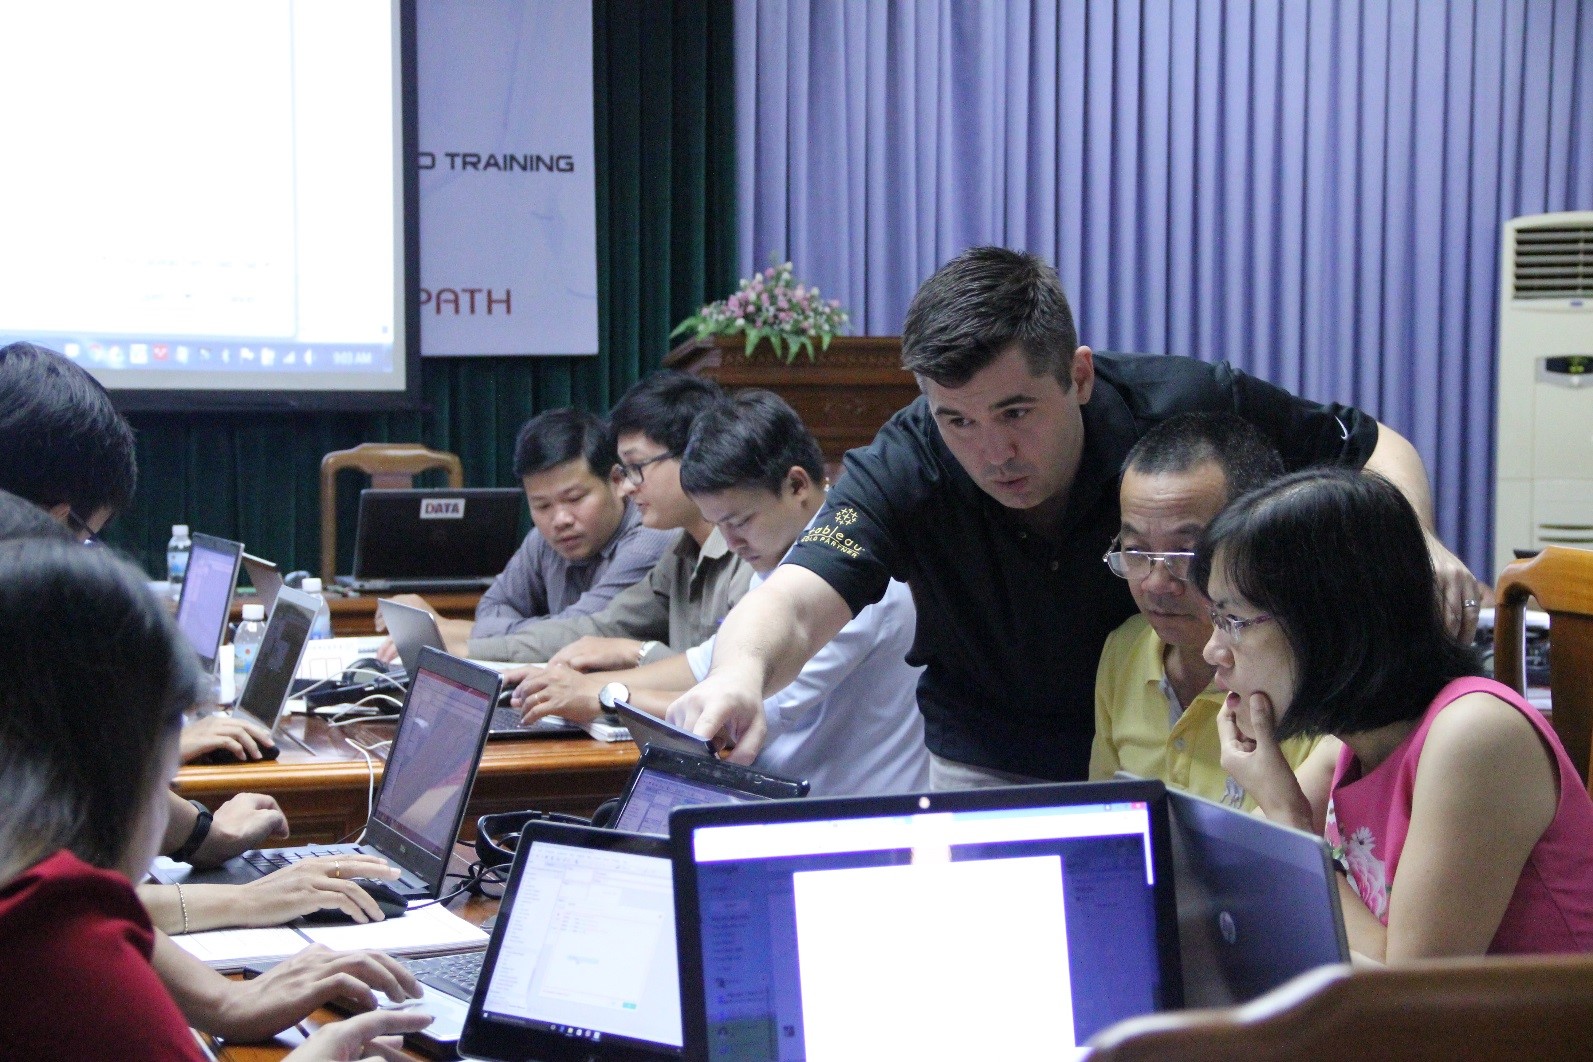
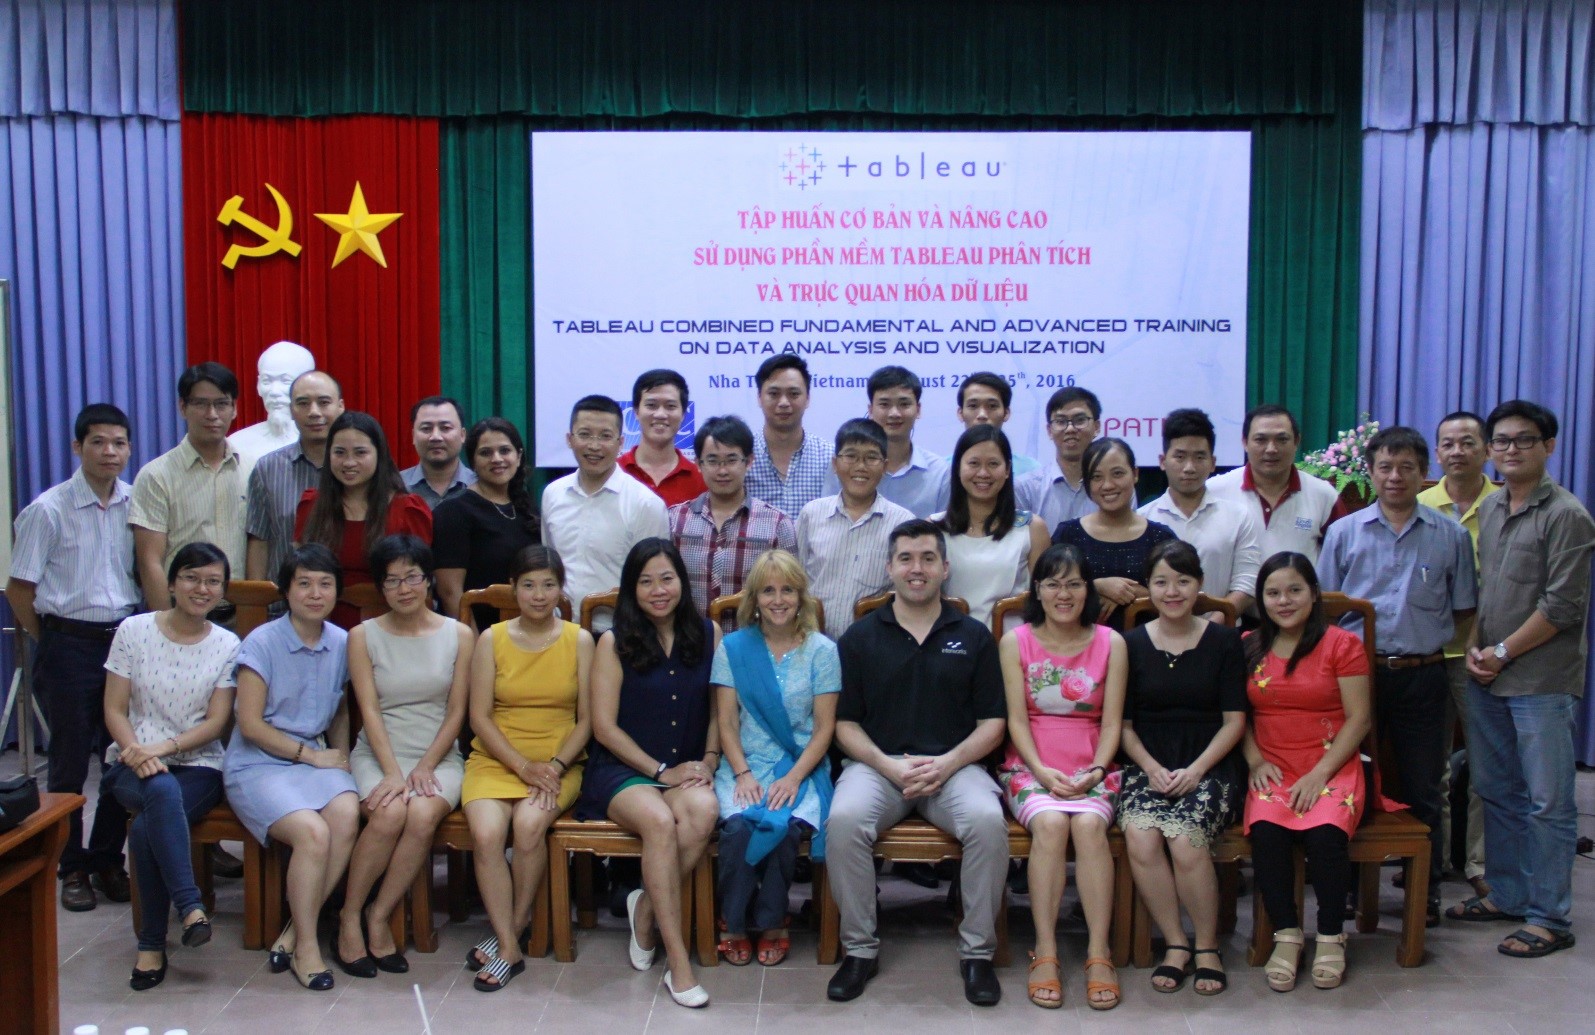
So, here I was, on a plane headed to Nha Trang to teach a week long course on Tableau to attendees from various departments and agencies within the Vietnamese Ministry of Health and the PATH Vietnam team. Thirty students. That’s a company record for InterWorks. That’s no small feat in itself. We have a trainers that teach Tableau classes all over the world.
The classes were held at the Pasteur Institute in Nha Trang. My class consisted of medical doctors, IT professionals, aid workers and more. Almost no one had used Tableau. Few had any experience with data analytics. To make matters even more challenging, there was quite a mix of proficiency in English in the class.
Was I in over my head?
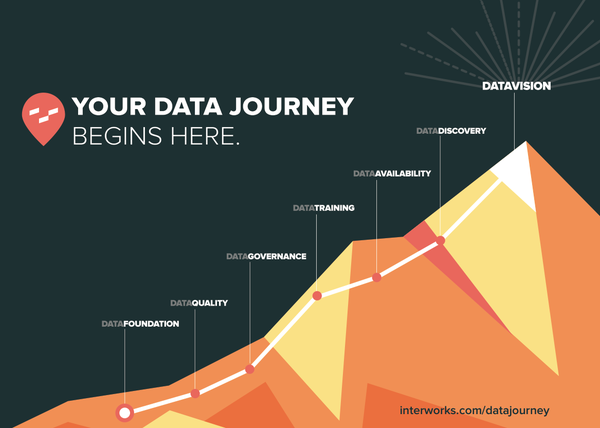
The Data Journey
Our business intelligence consultants have developed a concept called the Data Journey. We use this message to speak to current and potential clients about how we can help depending on their stage in building an analytics culture on an enterprise platform. It’s climbing a mountain of progressively more sophisticated ways of using and leveraging data. The core of Tableau’s power comes from bringing in many different types of data and making it work together, synergistically.
This was the idea that was running through my head all week. To be honest, I was amazed at the tenacity of my students and their excitement to have the opportunity to learn and use Tableau.
When I arrived at the Pasteur Institute, I had two translators ready to convert English to Vietnamese for my students. My contact with PATH in Vietnam, Mr. Quang Tran, was learning Tableau on the fly and then walking around the room during our practices exercises to help me work with students. He seemed to become a Tableau expert almost overnight.
When students didn’t have computers to learn, their colleagues pulled them over to share time on the keyboard on their own computer. When someone finished early, they gathered around another student’s computer to help. When something clicked about Tableau Desktop or a new idea sprang forth from discovering a new feature, I could see the excitement on their faces. By the end, there were ready to tackle their own data sources. They knew what type of data they needed and how to use Tableau to make the most impactful analyses.
All I could think is, “this is the data journey.” This. If you’re a true believer in Tableau, then you believe in the democratization of data. Data to people, right? This is that philosophy in its purest form. Divided by geography, culture and language, people from all over the world came together in an effort to save lives and hopefully change the world.
Big Data, Big Goals
At the end of the week, the students were given certificates after completing the Tableau Fundamental and Advanced training courses. We shared smiles, handshakes and told jokes about our adventures in the karaoke bar from the night before.
I left Vietnam having learned more than I taught. I left with 30 new friends.
To the Tableau Foundation, to PATH, the CDC and the many different agencies within the Vietnamese Ministry of Health, thank you. Thank you for letting me be a part of your Data Journey.
You have certainly been a part of mine.
The featured training and this blog were made possible through Cooperative Agreement Number 1U2GGH001812-01, funded by the Centers for Disease Control and Prevention. The contents of this blog are solely the responsibility of the authors and do not necessarily represent the official views of the Centers for Disease Control and Prevention or the Department of Health and Human Services.