
A way that we assist clients who have SonicWall appliances is by enabling SNMP (Simple Network Management Protocol) on the WAN for our company. This allows us to have additional information that we can use in the future. One piece of that information is the ability to be able to monitor network bandwidth, which helps us to track problems.
There are a few things we do with the client SonicWalls to help make this as secure as possible. First we allow only external SNMP monitoring from our corporate IP. Second we switch the default community name over to a custom name for each and every client.
Next download STG.exe (SNMP Traffic Grapher). This little piece of software allows you to easily monitor the current traffic (inbound/outbound) passing through your SonicWall in real time. It will also keep a history of up to the last 6 minutes and 40 seconds that it has been up and running.
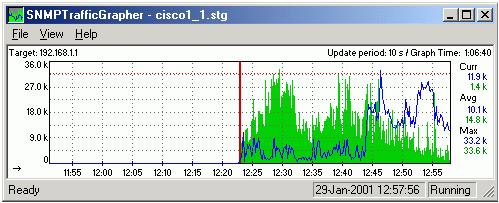
If it is configured properly, the Green solid lines are the inbound (download) performance and the Blue Line is the outbound (upload) performance.
Here is a sample of the settings you might see for one of our client’s SonicWalls:
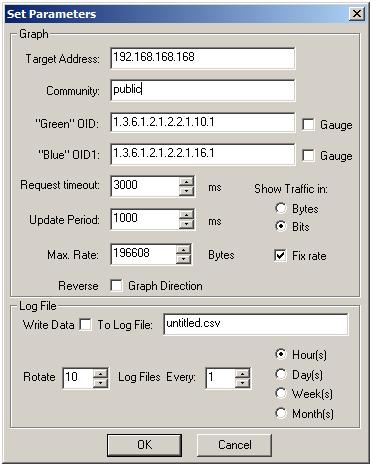
The Target Address would normally point to their external public IP address, but in this demonstration I pointed it to the default internal IP address (LAN) of the SonicWall. If you want to give the client themselves the ability to monitor their own internet connection you can set STG up on their machine and point it to their internal default gateway address.
The Community would be your SNMP community name (Get Community Name on the SonicWall OS)
Next you have the OID (Object ID) which we have placed with the Green as inbound and Blue as outbound. Please see part 2 (Obtaining OID) for help with getting the proper OIDs for your device if the ones above do not work since they change from SonicWall to SonicWall. You might also want to monitor different ports/lines in the future.
Finally, located at the bottom of the Graph section, we have the time out (how long before it draws a red line saying it isn’t working), update period (time between refreshes), and with the Show Traffic in:, Fixed Rate, and the Max Rate we have the settings for how fast the line can go. For the example it is set to show a T1 equivalent or ~1.544 megabits per second.
The bottom section (Log File) allows you to collect and rotate the logs for reference.
Updated links to newer sections:
Link to Part 2 of 2 – Finding your STG Settings