
Hey, party people! Guess what time it is? It’s Mappy Hour!
Tableau has been cranking out new mapping features left and right, but few have had me as excited as the spatial join with the release of Tableau 2018.2. This is the mapping tool I’ve been hoping to see in Tableau for a long time. Why? The spatial join opens up a whole new world of spatial analysis, as it’s Tableau’s first real spatial analysis operation. Heat maps are cool, but a spatial join is the real deal.
A spatial join is one of the most commonly used tools in the GIS analyst’s toolkit. It’s an operation that sets a spatial data analyst apart from a data analyst. Guess what? Now you can get in on the spatial action with an easy-to-use tool built right into Tableau.
So, What is a Spatial Join?
A spatial join is simply joining information from one geographic data table (often called a layer in map speak) to another geographic table using the geographic location of one table relative to the other. In Tableau, these layers will be shapefiles, KMLs or GeoJSON.
Like a normal join, we’re taking columns from one table and joining them to another table, except instead of using a key field, a spatial join uses a record’s location in coordinate space (i.e. its place on a map).
There are many different types of spatial joins. For now, Tableau’s implementation is a geographic intersect. As the name implies, the join happens when one geographic layer intersects another. You’ll need a point layer and you’ll need a polygon layer.
Here’s an Example
We have a point layer (in dark orange), and we have a polygon layer (in teal). These are two separate files, and we want to count the number of points inside each polygon. To do this, we’ll need to join the name (A, B or C) of the polygons to the points that are inside, but only where the points intersect the polygons.
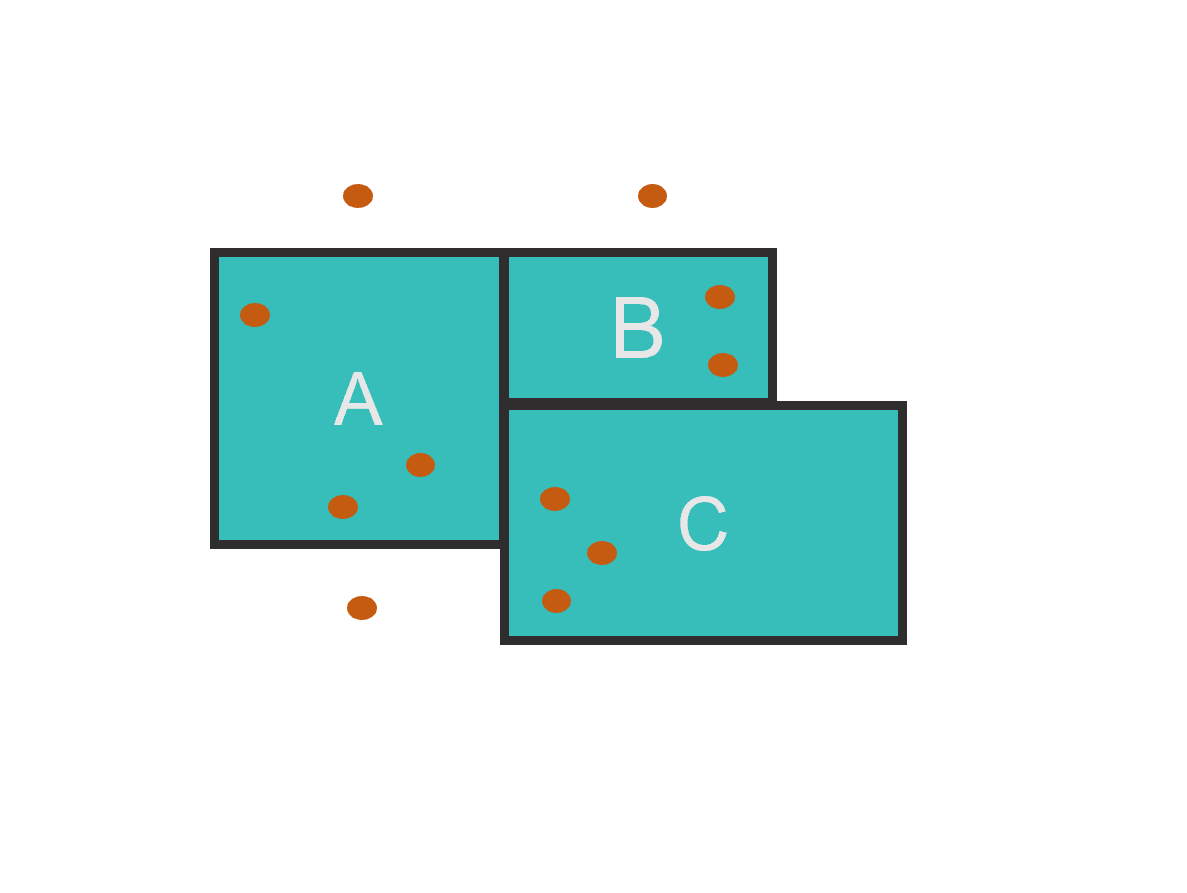
A spatial join in this example would join A to the three points inside A; B to the two points inside B; and C to the three points inside C. If I choose a left join, the three points outside of the polygons will have a NULL, just like a tabular left join when there’s no corresponding value to join to on the right table. If I choose an inner join, the three points will not be in the resulting dataset, as those records will be dropped.
Some Spatial Join Scenarios
- Example 1: You’re an analyst for a school district. You want to quantify the number of students living inside the school boundaries for each of the district’s elementary schools. You have a point layer representing where students live, and you have a polygon layer representing neighborhood boundaries. To get the count of students in each school boundary, you’ll use a spatial join to join the name of each school boundary to the student points that reside in each boundary.
- Example 2: You’re a business with custom trade areas. You have a list of geocoded customer addresses and want to associate each customer with the trade area in which he or she resides. A spatial join will intersect the customer address locations with your customer trade areas, giving you a trade area for each customer.
- Example 3: You’re a business looking to open a new store. You have a list of several dozen potential locations, but you want to pick a neighborhood where the demographics match your target customer. You have a spatial layer with census tracts and the population/demographic fields you’re interested in. You need to tie in the demographic information from the census tracts into each of the potential store locations. A spatial join is the tool of choice here. By intersecting (via spatial join) potential store locations with the census tracts, you can now compare the neighborhood demographics across all your candidate store locations.
Hands-on Spatial Join Example
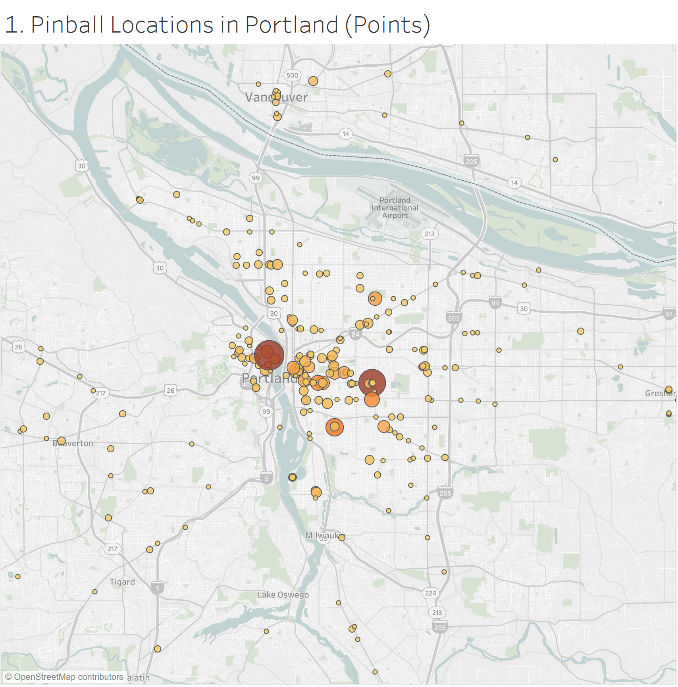
I love the game of pinball, and I live in Portland, so naturally I want to know the best neighborhood for playing pinball. Where in Portland can I go to find the most pinball machines?
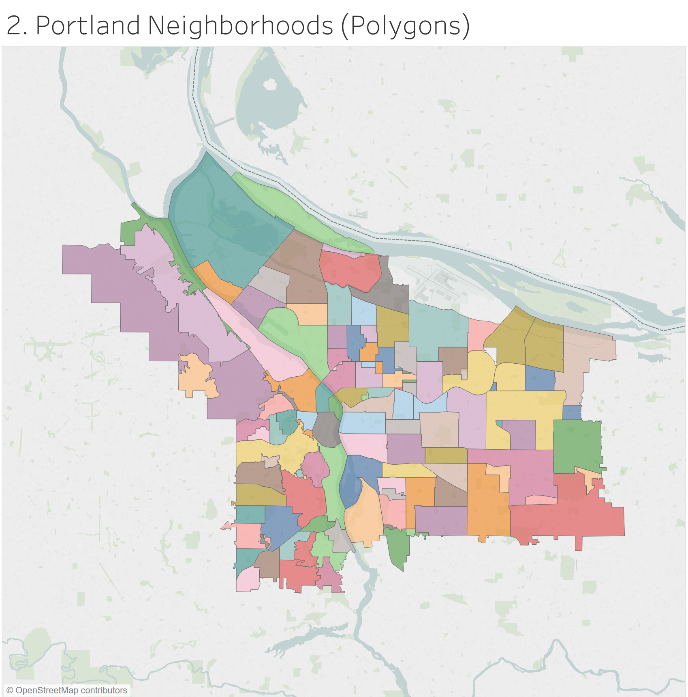
I have two datasets (shapefiles): pinball locations (points) and Portland neighborhoods (polygons).
I want to join the neighborhood name into the intersecting pinball point location. I’ll use a spatial join, which can be conveniently accessed in the same way you’d do a tabular join in Tableau:
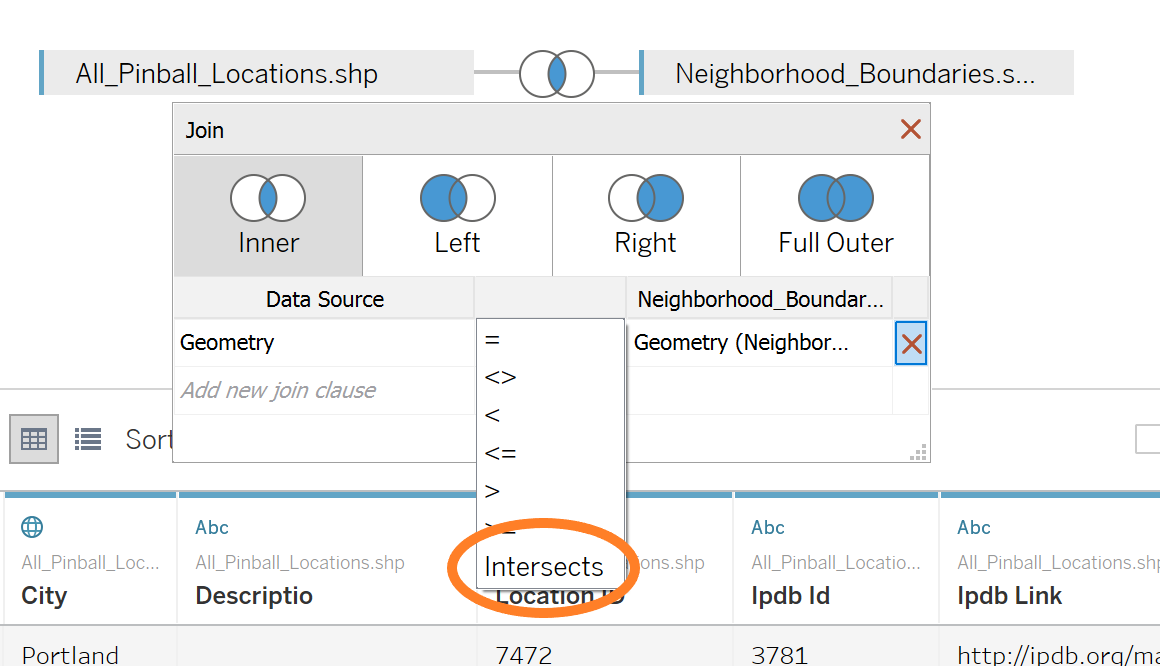
- Select spatial fields. Since I’m not joining based on a key field but based on location, our two fields to join on are the Geometry fields (or those fields that retain the spatial information for the record).
- Choose Intersect. After selecting the spatial fields, the dropdown that contains the join operators now has Intersect. This is our spatial join.
- Choose join type. Because a spatial join is still a join, you have the option of choosing Left, Right or Inner. These options work nearly the same as they would on a tabular dataset. For example, if you choose Left, you are maintaining the records on the left side and joining only the records that match (or intersect) from the right side.
In my case, I only care about pinball machine locations (points) that intersect the neighborhoods (polygons). So, I’ll choose an Inner join so non-matching (or intersecting) records drop out.
Voila! A spatial join.
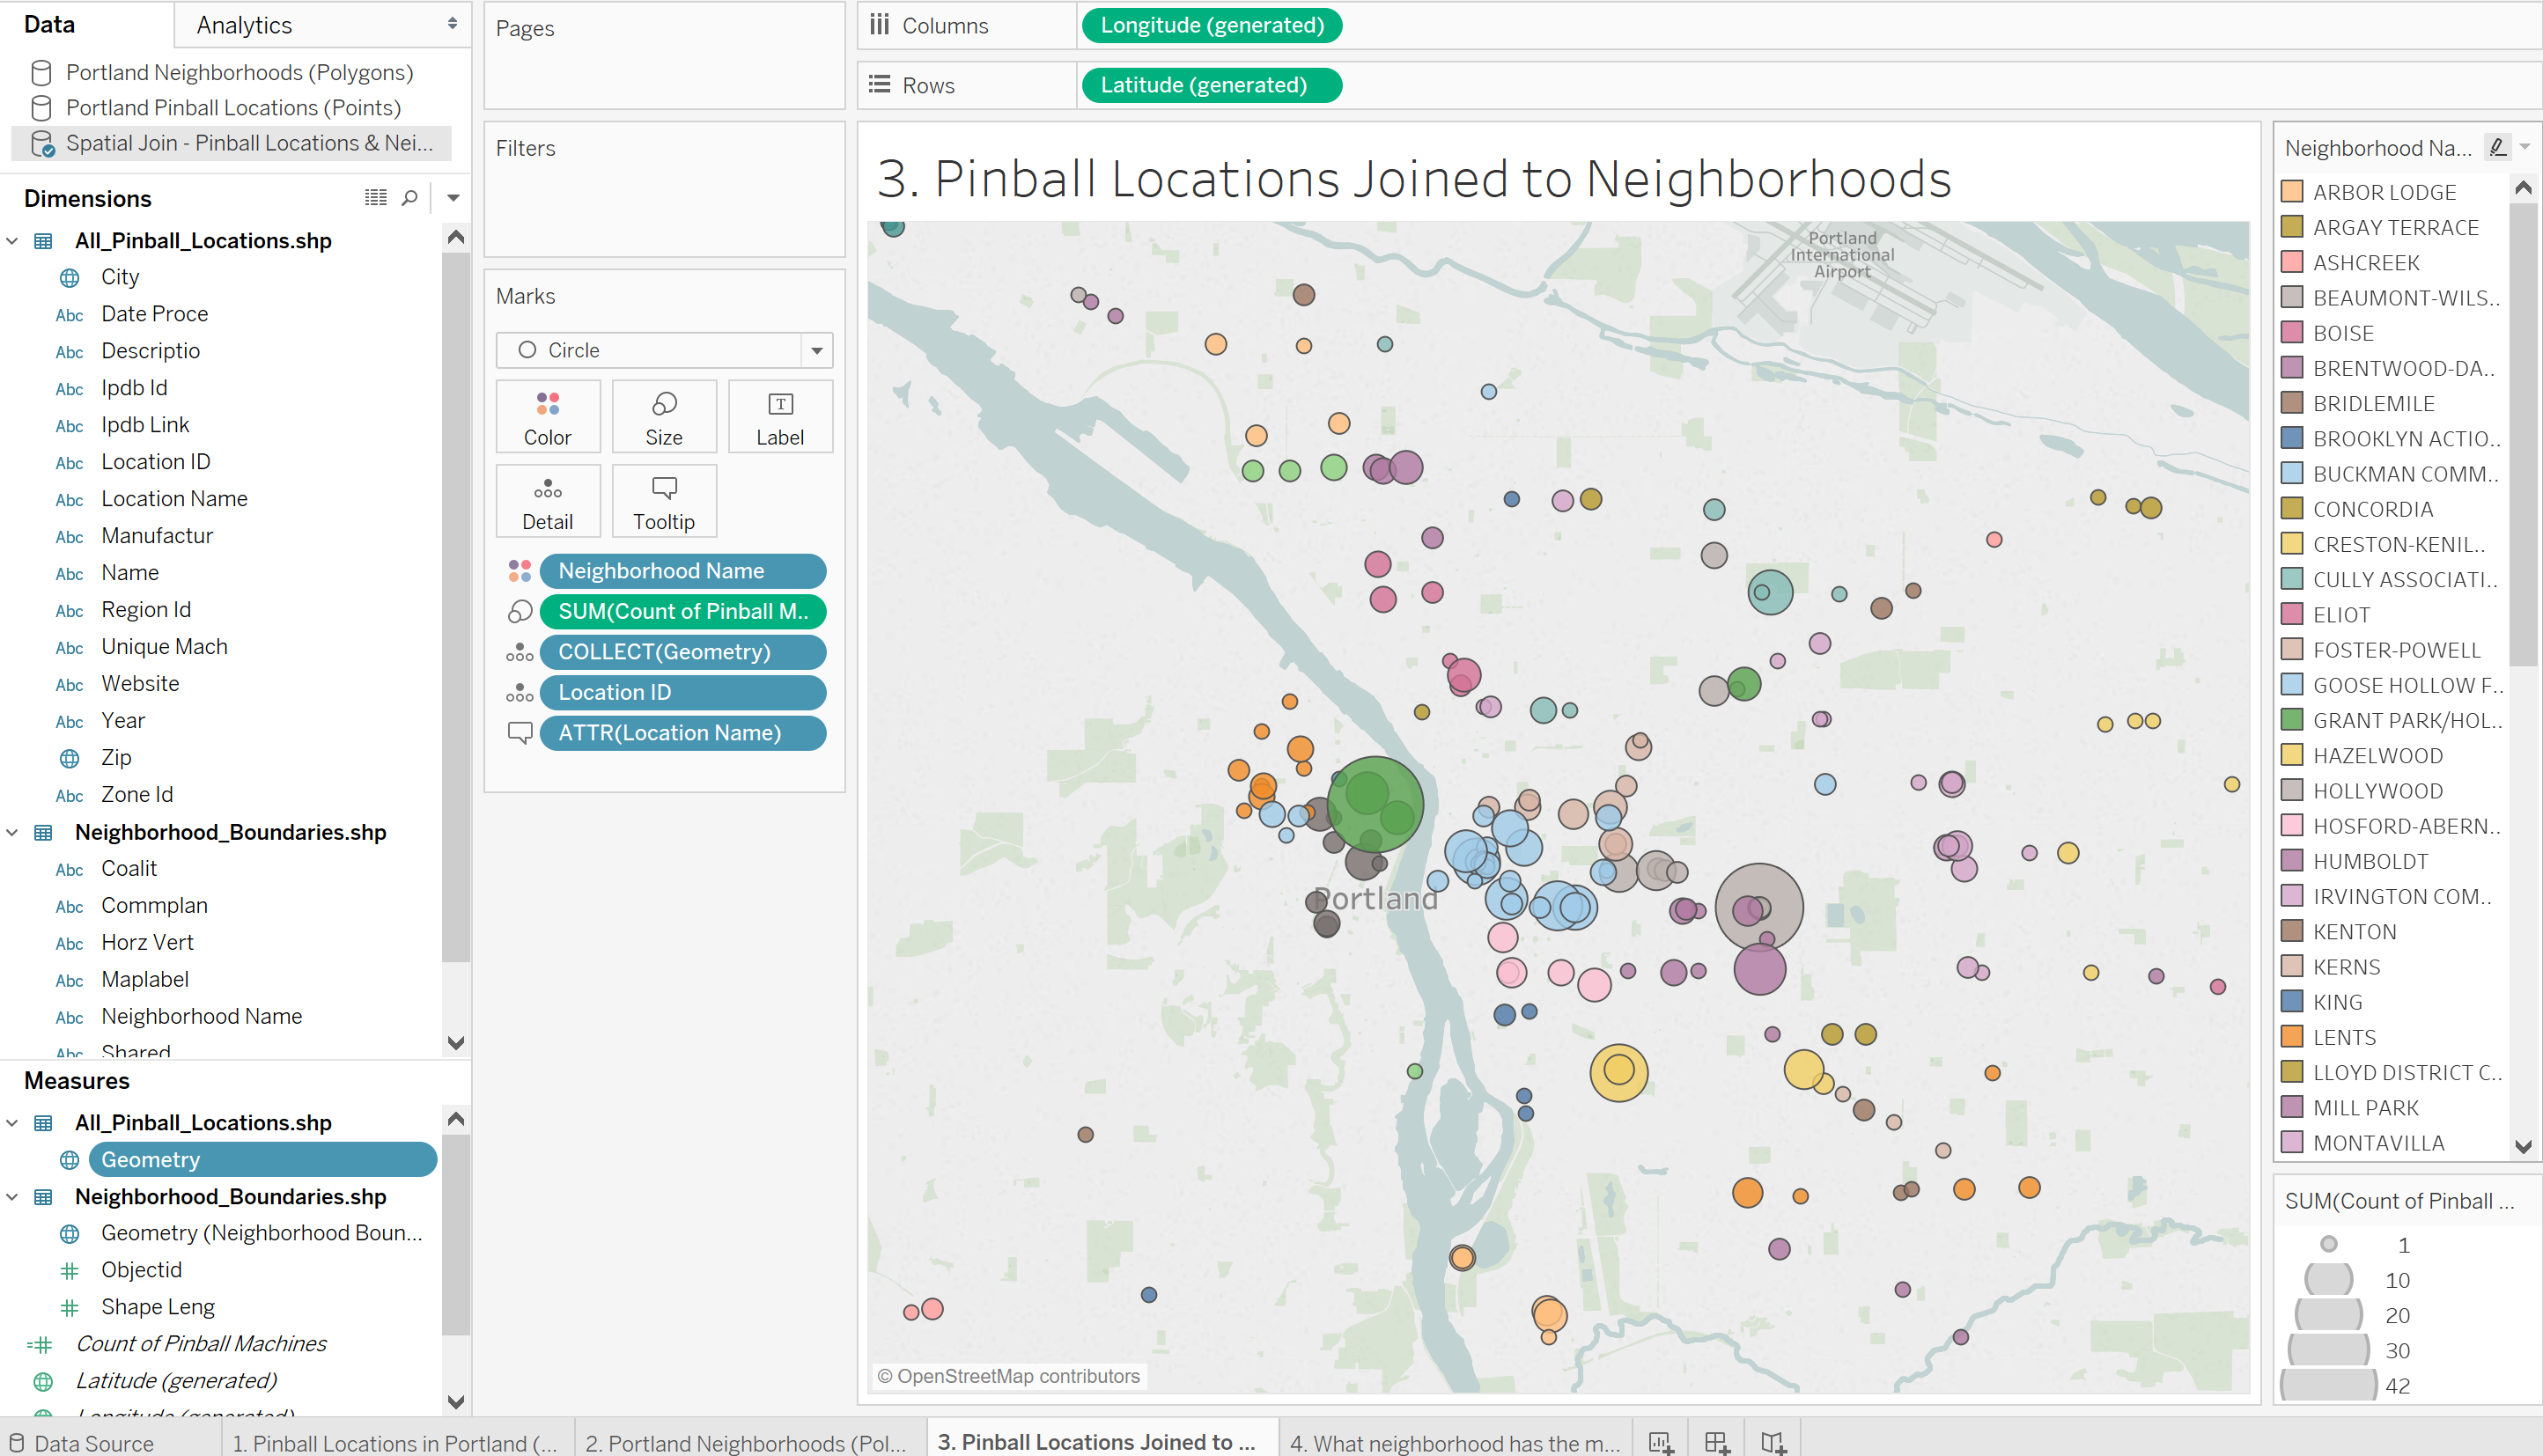
Once my two datasets are joined via an Intersect, I have access to the neighborhood (polygon) fields to use in my pinball locations (points). This allows for me to do some real analysis. For example, I can color the points by the neighborhood they reside in (see image above).
Notice that since I chose an Inner join, there are no points beyond the boundaries of the neighborhood layer. Only those points that intersected remain. Now that I’ve completed the spatial operation and have neighborhood information associated with each pinball location, I can answer my original research question by summing the number of pinball machines in each neighborhood.
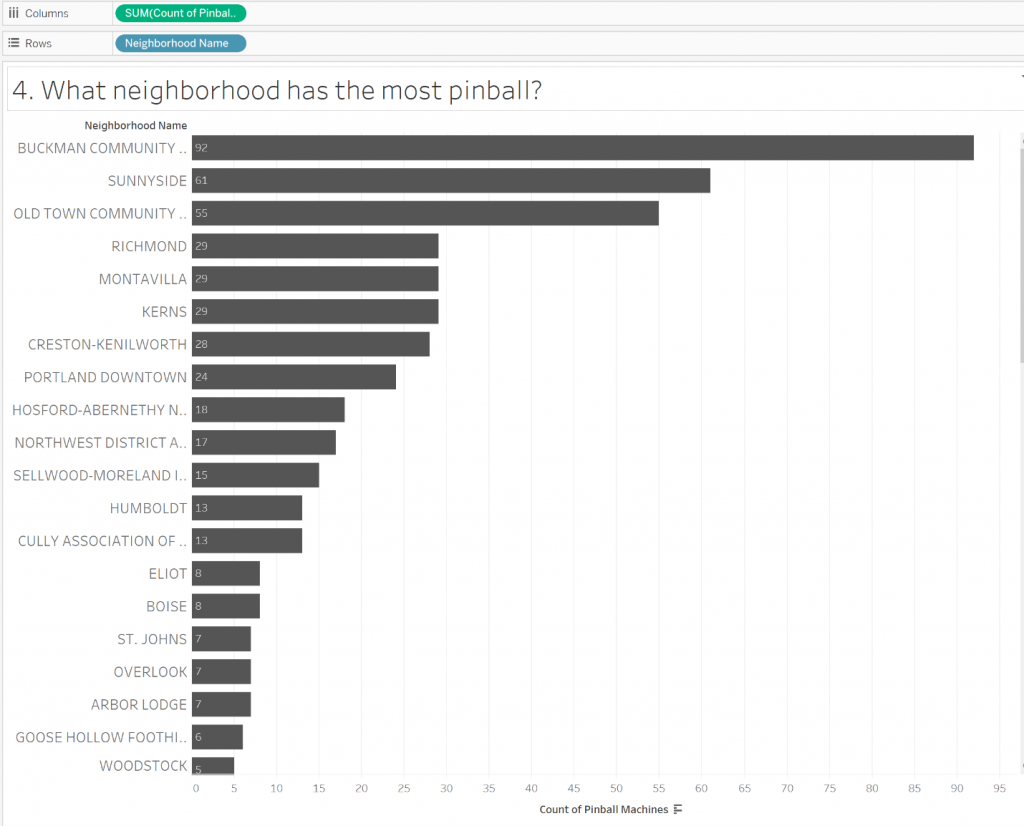
My original question: What Portland neighborhood has the most pinball machines?
Now I’ve got my answer: The Buckman neighborhood with 92 pinball machines!
BRB. I’ve got, uh…errands to run.
(See attached packaged workbook)