The Value of Measures?
What are Measure Names and Measure Values and how do they work? These are built in Tableau fields and they have 2 main uses or strictly speaking two variations of the same functionality. The first is a Combined Axis Chart and the second is a Crosstab with multiple measures.
Combined axis chart.
A combined axis chart can be used if your measures are similar e.g. if Sales and Profit are both in the same ball park then they could feasibly be put on the same axis without one of them appearing to be permanently zero.
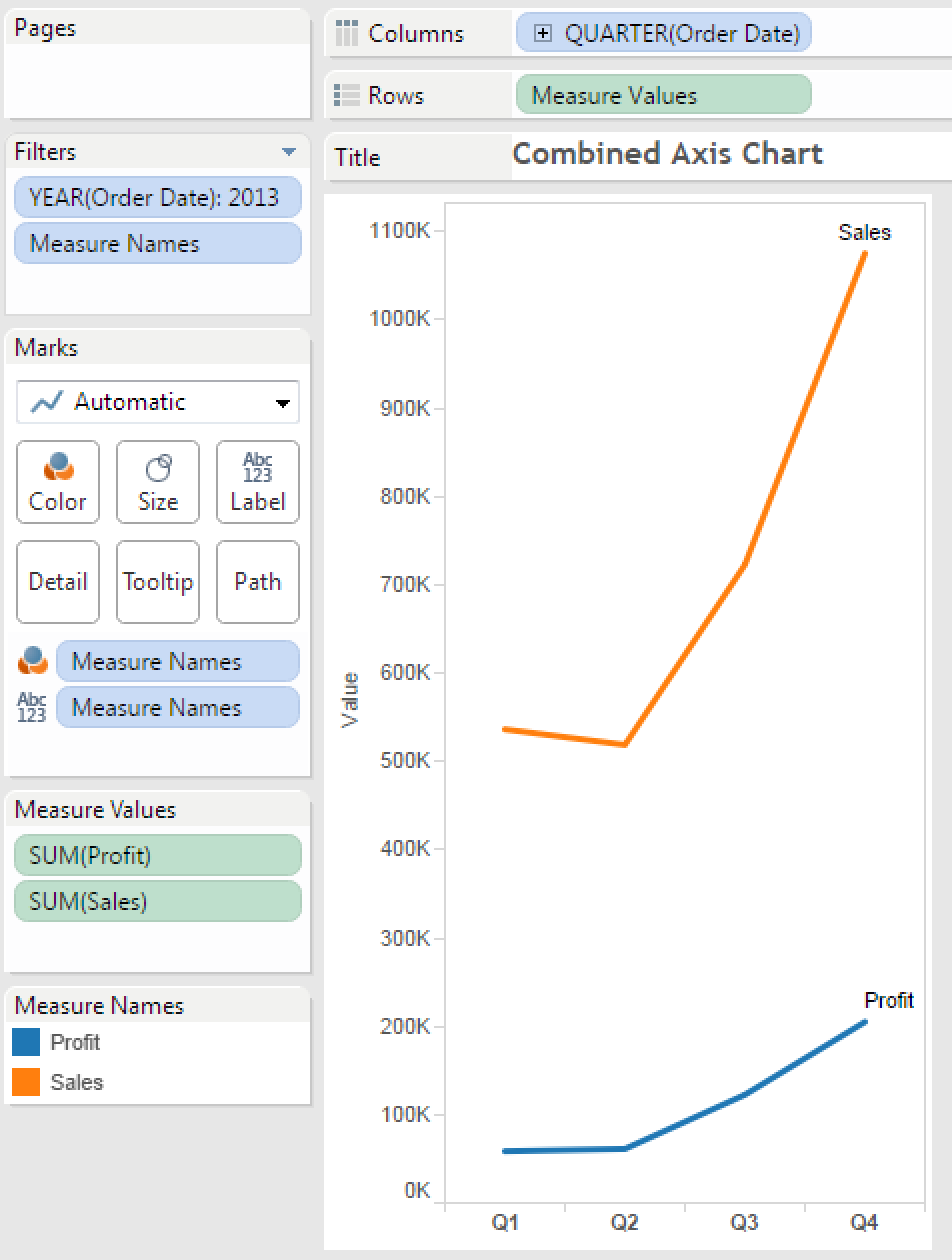
The combined axis chart shows Measure Values once in the rows shelf, whilst Measure Names appears three times. I should also point out that a new shelf has appeared called Measure Values.
If we look at the numbers we can see that we have 2 measures in the chart above, Sales and Profit. This means that the Measure Values are the numbers which correspond to those Measure Names (Sales and Profit). It is the 2 Measure Values which we are plotting on the axis hence that appears in Rows.
It is the Measure Names which are dividing the colour (Orange for Sales, Blue for Profit) hence that is on the marks card (I have also added it as a label). Finally Measure Names appears on the filters shelf because we have more than 2 measures in our dataset but we only want to display Sales and Profit.
Shortcut: How to create a combined axis chart in 3 steps.
- Order Date to Columns
- Sales to Rows
- Profit to Axis.
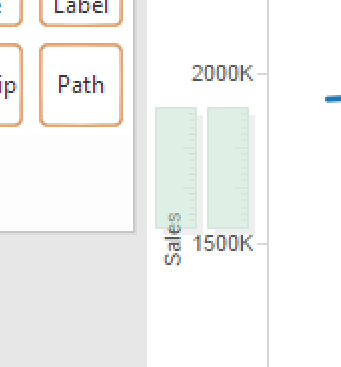
When performing step 3 you need to make sure that you drag the profit field on to the existing axis such that a faint green double-ruler appears.
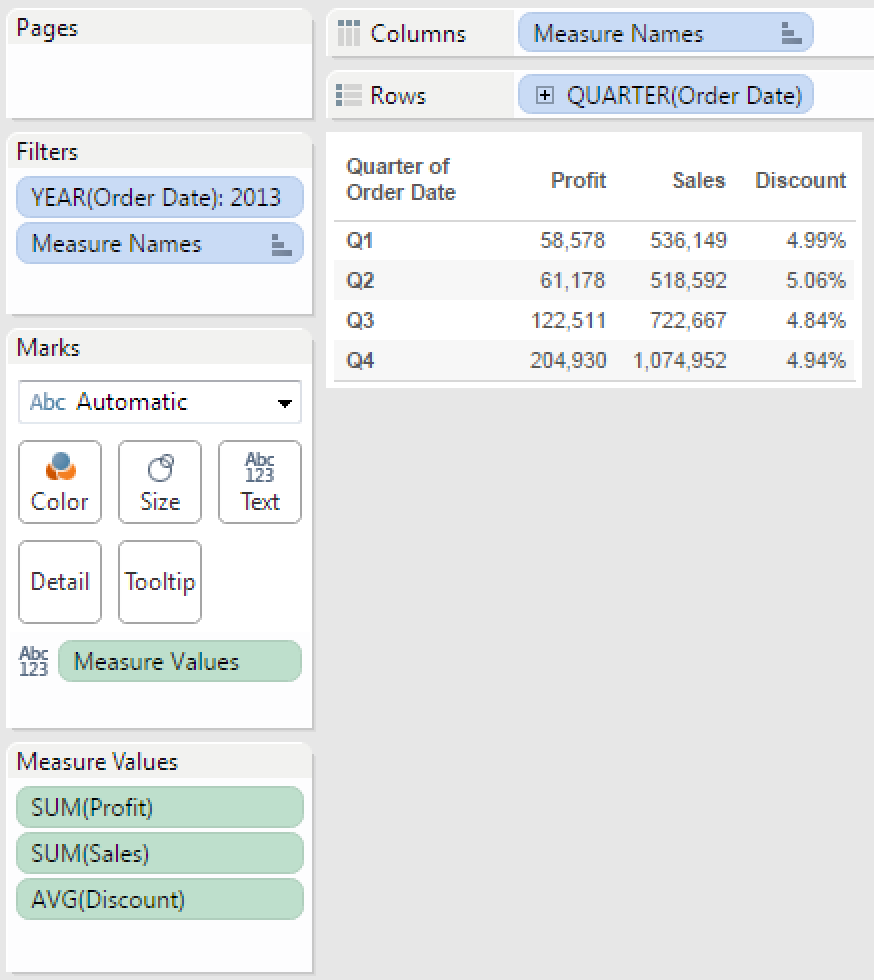
CrossTab (Table) with Multiple Measures
Shortcut: How to create a Crosstab from Multiple measures in 3 steps
- Order Date to Rows
- Sales to Workspace, where it says ‘abc’ in the pane
- Profit to Workspace, where the Sales figures now are. (or you can double click Profit)
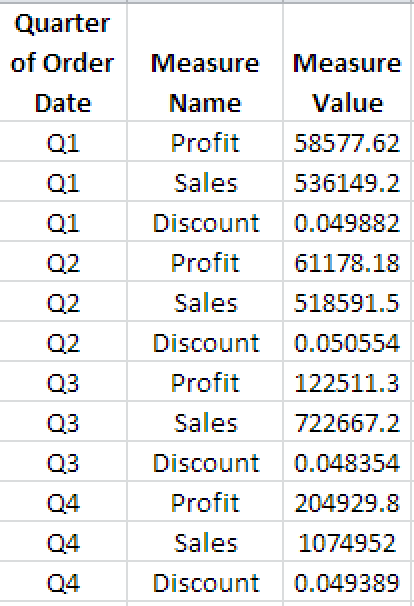
Let’s consider a table with a set of dimensions (Quarter of Order Date) and one measure per column. Measure Names / Measures Values are essentially data reshaping tools.
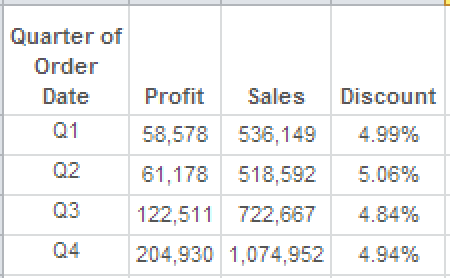
To look at it another way what we have are two dimensions and some values. The first dimension contains: Q1,Q2,Q3,Q4.
The second contains the headers (Measure Names): Profit, Sales and Discount.
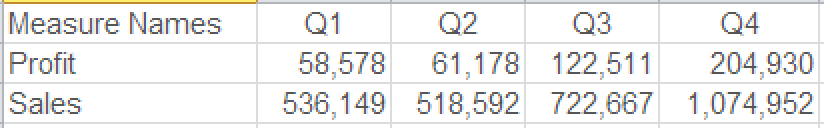
The table to the right is what is effectively happening in the background when we use Measure Names & Measure Values to create a Crosstab from multiple measures.
The Rows are Quarter of Order Date and the Columns are Measure Names. It is this data reshaping that makes it so effortless to create the table below.