
Do I have a healthy pipeline of sales opportunities?
Ensuring a healthy pipeline of opportunities is a key concern of any Sales Manager. In this post I would like to share with you a way of visualizing your pipeline that has proven highly valuable in practice. It is based on the method and terminology that Miller Heiman define in their Strategic Selling approach.They call this the Sales Funnel – and that is the term I will use here.
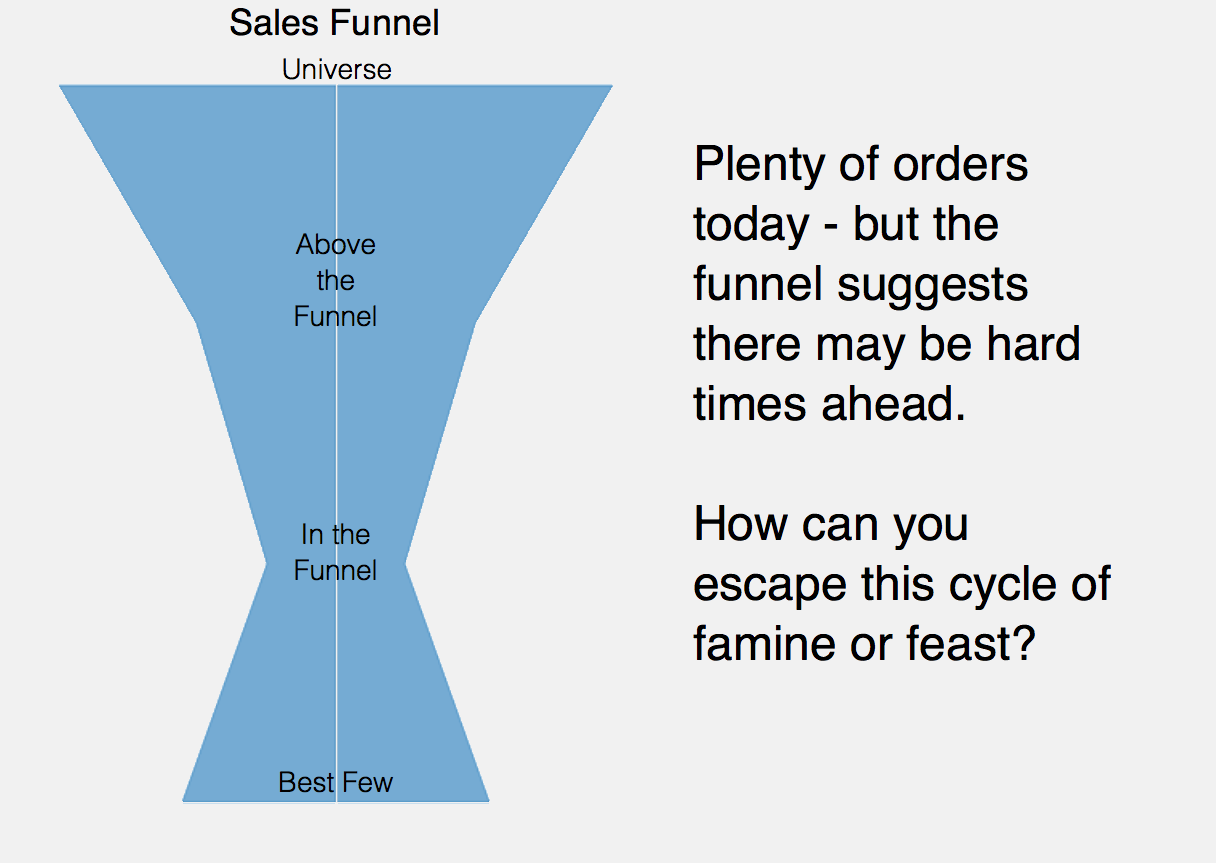
Simplistically put, a sales funnel models the process of discovering potential sales opportunities, qualifying them to see if further selling effort makes sense and then doing the work needed to develop them into orders.
Early prospecting and market research may uncover a wealth of opportunities where there may be potential to sell. These would typically be classified in our Universe until they have been investigated further. The following investigation, known as qualification, aims to find out if there is a real fit between the needs of the customer and the products and/or services on offer. It also aims to ascertain if this is a priority that is likely to be acted on in the short term. While this qualification effort is taking place the opportunity would be placed Above the Funnel.
If qualification suggests that further sales effort is worthwhile then the opportunity would move In the Funnel. This is where most of the sales activity takes place: to identify the people that will influence the buying decision and seek alignment with their needs. As the selling efforts are concluded and the opportunity is close to order then it moves into the final stage: Best Few.
A healthy funnel will have enough opportunities at each stage to fuel a steady stream of business that the selling organization can influence. So there are two key factors at play – the overall size of the funnel and its shape.then it moves into the final stage: Best Few.
Traditional sales funnel charts visualise this as an actual funnel, where the width at each stage reflects the potential business volume. Unless the funnel is grossly out of shape it can be hard to see at a glance if a funnel is healthy or not. To make this possible you need a reference to show what a healthy funnel should look like. Also the visualisation needs to make comparison between the actual and reference funnels very easy to do at a glance.

The visualisation developed using Tableau shows the health of the sales funnel at a glance. The solid colour bars show the actual value of opportunities at each stage of the selling process. The lighter bars show the size and shape of an ideal sales funnel. This ideal funnel is modelled on the opportunity to sales conversion rates and sales cycle times that are typical for the business in question.
Many users will be familiar with a tapered “Funnel Shaped” view. For comparison this type of layout is shown in the picture at the top of this post. Although there may be benefits in familiarity, this design carries two significant drawbacks. Firstly, the shaping does not reflect any meaningful information that might change over time. Secondly, the most valuable section of the funnel, Best Few, is actually shown with the smallest size and lowest position – hardly reflecting its real value.
Tableau allows this modelling and visualization to be done quickly and easily without complex programming or manipulation of graphics. Filters make it possible to drill down for higher detail – for example to see how the funnel for a specific product line or region is shaping up.
Looking at the shape of the funnel and recognizing where there are deviations from ideal allows a sales team to adjust the focus of their sales effort quickly and early to maintain a steady stream of business. This is a great example that shows how seeing the full picture can help you deliver consistently outstanding performance.