
Many of us at InterWorks are avid sports fans, as you can see from our various blog posts and the many examples in the Viz Gallery. While these examples tend to focus a lot on football (pro or college) and various other sports, I wanted to bring a bit of hockey into this blog. What better time to do that then right before the Stanley Cup Playoffs!
Not only are the Stanley Cup Playoffs a great time to watch and get into hockey (playoff season was actually the time I became a fan), but the NHL has incorporated a bit of March Madness into their tournament in recent years. With conference realignment came the Stanley Cup Playoff Bracket Challenge. There were a couple of reasons for this:
- Now divisional foes will face each other in the first two rounds of the playoffs, breeding bitter rivalries.
- We as fans can now fill out our very own NHL bracket, much like March Madness (as if you didn’t already have enough of busted brackets).
Using Data to Fill a Bracket
Unlike for March Madness, I have some sense of which teams are contenders and which teams are not so much. Furthermore, I have a better understanding of which stats are indicators of success. I wanted to share this with others who might be hockey fans (or new fans who want to play along with a bracket challenge) and build a Tableau viz.
Much to my dismay, the functionality that I wanted to incorporate into a dashboard wasn’t readily available within Tableau itself. I was hoping to be able to select any two logos in the dashboard and show the head-to-head matchup for those two teams in the same dashboard, comparing key stats quickly and easily. Although a solution in Tableau desktop does exist, the solution was rather messy and inelegant. I opted to solve this problem another way.
Tableau’s JavaScript API Saves the Day
In discussing the problem with fellow InterWorker Tom McCullough, he suggested that instead of trying to make a messy solution work in Tableau desktop, why not make a cleaner solution using the JavaScript API. I had very limited experience with JavaScript and had only fiddled around with the JS API before and dissected Robert Rouse’s example of next-level Tableau dashboards. I had never created something like this from scratch. Alas, I figured it was the best option to create a clean solution for my problem, and I set off to build a wrapper for a simplified version of my Tableau viz. Below is the final viz in its new wrapper, followed by the steps required to create it:
Step 1: Building the Webpage
The first thing that I needed to do was build the actual webpage. Not having a background in graphic design, it naturally took a bit of time to make the page look like it didn’t come from the web in the 90s. There were many iterations, and with the genius of David Duncan from our Marketing Team, I had a layout and game plan for what the wrapper should look like. After several hours of relearning HTML and CSS, I had the webpage all set to go. With this step complete next came the JavaScript.
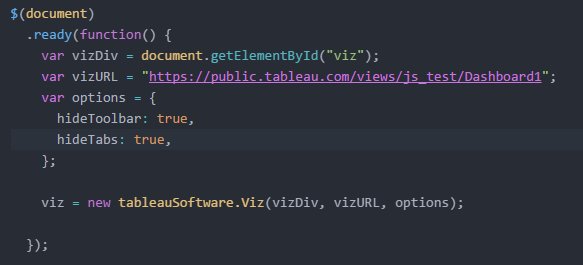
Step 2: Embedding My Tableau View
The next thing I needed to do was to embed my simple Tableau view and have it come up once the page was loaded. Using Tableau’s online JS API tutorials, I was able to easily accomplish this using the code below:
Great, the visualization loads in my webpage. But how do I filter the Tableau viz using webpage elements? In particular, I want to be able to click any logo on the webpage and have it filter the Tableau view to give me that team’s key stats. Well, this too will require some JavaScript goodness.
Step 3: Matching & Filtering Data
First, when I click on an image, I need to be able to pass some sort of information from my webpage to my Tableau visualization. In this case, I want to select a logo and filter my viz to show that team’s data. So, I needed to add an attribute to my images that identically matches a specific field in my data.

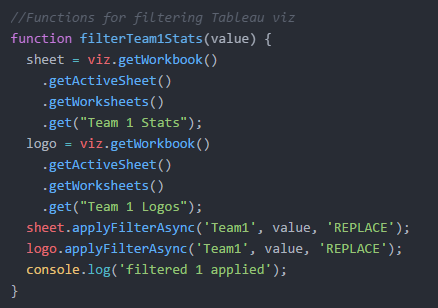
Once I had this, I went to my JavaScript and coded up a conditional statement. For every odd click, I wanted the left column of my view to be filtered. For every even click, the right column would be filtered. So, I needed to do a couple of things:
- I needed to target specific sheets in a dashboard.
- I needed to filter those sheets by the team a user would select.
I created a pair of functions to accomplish this for each set of sheets (right and left) and plugged them into my conditional statement that counted clicks.
Once this was in place, viola! My webpage was then filtering my Tableau visualization!
The Final Word
Tableau is a great tool for data visualization, and we often times get really excited about designing our dashboards with exciting interactions. Every once in a while, we might hit a point where what we want to implement pushes the limits of Tableau desktop’s functionality. Often times there are two ways to handle these limits:
- Push Tableau’s limits and find a solution, regardless of how janky it might be.
- Try for an alternate, more elegant solution using some of Tableau’s more peripheral features.
Either way will be a great learning experience, but I tend to prefer the more elegant solution. And in this case, that solution required the use of a little coding and learning a bit more about the Tableau JavaScript API.
Now, head on over to the NHL website and fill out a perfect bracket using my viz to predict who will win each best-of-seven series all the way to the Stanley Cup!