Next week, there is a little conference going on in the great city of San Francisco called Graph Connect. Graph Connect is the only conference of its kind. It’s a conference that focuses solely on the world of graph databases and applications, featuring the leading graph database, Neo4j. In honor of this conference and my excitement over the subject, I thought I would write a bit about graphs. Specifically, I wanted to share an anecdotal tale on the field and possible uses of graphs in the real world.
The Königsberg Bridge Problem
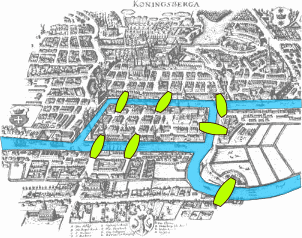
At its core, graphs were first used as a purely mathematical way to solve a fun problem. In the former city of Königsberg, Prussia, currently Kaliningrad, Russia, there are four land masses separated by water with seven bridges connecting these landmasses. You can see these bridges in the image below:

The question of the day was: Is it possible to traverse every one of the seven bridges without using the same bridge twice? It’s a fun riddle that the locals would ponder about and playfully try to solve by choosing various routes throughout the city.
But in 1735, a gentleman by the name of Leonhard Euler (pronounced Oiler) determined the answer abstractly. In doing so, he pioneered the field of graph theory. In his solution, Euler realized that the features of the land masses were irrelevant, so each landmass could be represented simply by a point (usually referred to as a node or a vertex, depending on the setting). In essence, Euler reduced the problem to simply following paths between vertices (the landmasses) and the edges (the bridges) that connect these vertices. Below is the graphical representation of the Königsberg Bridge Problem:

This modification might not seem like much on the surface, but this reduction to vertices and edges has proven to be a very unique way of simplifying potentially very complicated problems. We will see this a bit later.
Now, let’s get to the solution for the Königsberg Bridge Problem. Without getting too into the mathematical details, Euler noted and proved that, for any connected graph, to be able to traverse every edge exactly once, every vertex (with the possible exception of the starting and ending vertices) must have even degree (even number of edges connected to that one vertex). With this is mind, Euler looked at the graph representation of the Konigsberg Bridge problem and noticed that each vertex has odd degree. Because of this, Euler concluded that the Königsberg Bridge Problem was an impossible problem to solve (i.e. there is no such solution). An unexpected solution to such a seemingly simple problem.
Modern Day Uses of Graphs
Since 1735, there have been many advances in the field of graph theory and topology. With a rigorous foundation for the field being built shortly thereafter, today’s graph theory has grown to be quite broad in scope. Focusing only on the practical applications, we can see that there are many domains where the understanding of graphs and graph algorithms are vital to answering real business questions.
Social Network Analysis:
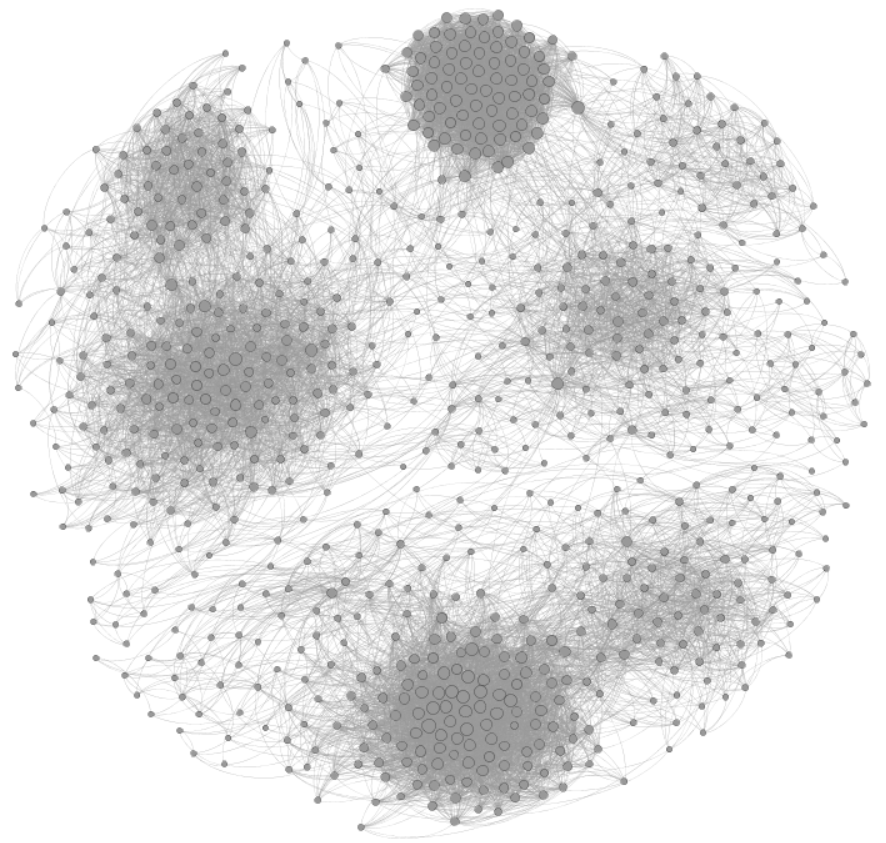
Probably the biggest known application of graph theory is Social Network Analysis or SNA for short. SNA is the study of social networks, their structure and how knowing this structure can lead to better understanding of behavior within social networks. The most well-known social network is, of course, Facebook. There are many tools freely available on Facebook that allow you to study your own social network structure and see patterns within your list of friends. You could even use tools like Gephi. Below is an example of an SNA graph:

More than simply being a tool to show social networking structure, graphs are used to predict what your interests are. These predictions are based not only on your own behavior within a social network, but also on the behavior of your friends. Equipped with this knowledge of not just what you like and don’t like as well as what your friends like and don’t like, companies can customize the ads they present to their customers through their Facebook or Twitter feeds.
Other uses of SNA include, but are not limited to, studying the structure and weak points of terrorist and criminal organizations, trying to understand the way human beings react and behave in various social structures, and predicting future collaborations within a field of study.
Path Optimization and Logistics:
When I was an undergrad taking a graph theory course, I was assigned an interesting project. The client was a hypothetical airline who needed a new system for finding flights for customers. This airline had planes flying between 18 cities. They needed a way to take customers from one city to another while ranking them by one of three conditions: least number of layovers, lowest cost or earliest arrival time. Having cities represented by nodes and flights between cities being represented by edges, we can see that this problem is merely finding the most efficient path based on which of the three conditions we want to be satisfied. This relatively simple problem has a very straightforward solution, provided you know about Dykstra’s algorithm.
Although the airline problem was quite simplified, it is directly applicable to any number of situations where “paths” of all sorts are used. Package delivery routes and scheduling, airlines schedules and map routing all use some form of path optimization to give the most efficient solution to the question: What is the most efficient route?
Network Analysis:
Ever wonder where your computer network is most vulnerable or susceptible to failure? Well, computer networks are probably the easiest thing to represent as a graph since networking pretty much uses graphs to represent the layout of any computer network. Check out the simple network diagram below for an example:

It’s easy to see that your graph will have nodes consisting of all the physical connections within a network (computers, routers, hubs, switches, bridges, etc.) and the edges in the network will be the actual connections (wireless or hardwired). Having a simple weighted network graph (weights on edges representing load capacities), we can determine if there are vulnerabilities within a network. For example, is there a single point of failure that causes the network to become disconnected? If there are no single points of failure and if something does happen to any part of the network, what are the impacts of that failure? How much longer will information take to go from one node to the next?
All of these questions can be answered with using graph analysis. Looking at all the paths between any two nodes, how central a node is in the network and other link analysis metrics helps us to understand where a network might be vulnerable to failure and what the consequences of potential failures might be. Keeping your business’ network operation is a vital concern to keeping your business running. A graph is a great tool for looking at your network in order to make sure that you’re prepared for the inevitable equipment failure.
Conclusion
These are just a few examples where graphs are greatly useful in everyday life. I am looking forward to Graph Connect and seeing even more uses of graphs in novel ways. I hope this post was informative and perhaps even a little entertaining. Once you start to understand how graphs work and you think about graphs in the way that Neo4j uses them, graphs will end up changing the way you see the world around you. I plan on sharing some of these examples in the weeks to come, so come back again soon!
Citations:
Image 1 & 2: http://en.wikipedia.org/wiki/Seven_Bridges_of_K%C3%B6nigsberg
Network Image: http://www.conceptdraw.com/samples/resource/images/solutions/network-diagram/Network-Diagram.png

