
What do Tableau Software, Business Intelligence and User Experience have in common? Combined, they represent the New Age of Data. More specifically, they push data visualization, data personalization and data emergence to higher levels of understanding. At the present moment, we are seeing a massive cultural shift in how we understand our corporate data, industrial data or, simply, our personal data.
One caveat: we need the right tool for the right job while simultaneously ensuring visual analysis has form and function.
‘To paint well is simply this: to put the right color in the right place.’ – Paul Klee
Simple and practical advice, right? Not really, especially when one considers the flood of color hitting the human eye. In fact, ‘Human eyes are exquisitely sensitive to color variations: a trained colorist can distinguish among 1,000,000 colors…for encoding abstract information, however, more than 20 or 30 colors frequently product not diminishing but negative returns’ (Tufte, 1990). This shouldn’t come as a huge surprise when creating visualizations in Tableau Software. If one looks at their diligent planned color palettes, you’ll be hard pressed to find one categorical palette exceeding 30 colors.
Why, then, is this important for visual analysis? Can’t we just throw data onto a chart and accept the defaults? Eh! Please. You wouldn’t hear a BI Engineer talking about a ‘galaxy schema’ of data just thrown around only to be left up to random chance and gravity; rather a seasoned BI Engineer knows that, for analytical workloads, a star schema is the most viable option. And you wouldn’t ever hear a surgeon saying: ‘Well, I’m just going to mess around in your chest cavity and see what I see.’
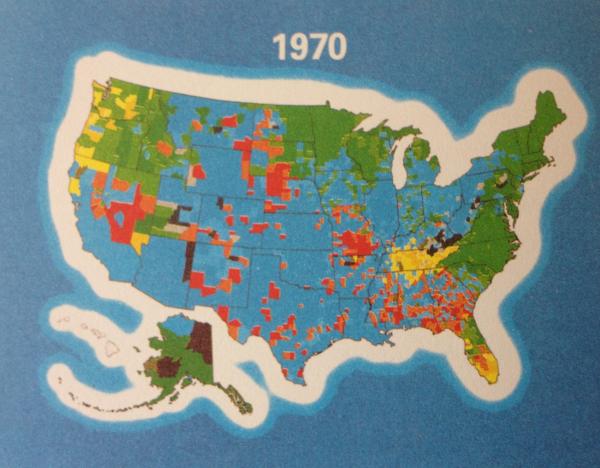
My point is that designing visualizations on datasets which can exceed 100 million records requires a skill and a desire to understand the user and his/her experience. One important feature, obviously, is avoiding the ‘visual war’ and the ‘1+1=3’ effects. In the image below, what immediately comes to mind? Typically, most people see the large, white border which takes away from what the user is actually supposed to focus on.
Visual analysis with Tableau Software should always eliminate any barrier to entry (read: analysis). The user shouldn’t have to ‘compute’ from container to container, nor should the user be bombarded with any unnecessary ‘data gristle’. A job well done by Tableau’s engineers; designing with a ‘human-centric’ perspective makes even the most stern of UI/UX professionals smile because of one huge advantage: Affordances.
‘A flat plate affords pushing, an empty container affords filling, and so on. Affordances can signal how an object can be moved, what it will support, and whether anything will fit into its crevices, over it, or under it’ (Norman, 1988). The expert Tableau developers know that a well-designed dashboard affords analysis. Users wanted to explore, drill down, lasso and any number of discovery features embedded into the product. Data which comes at us all with, at times, overwhelming speed can be harnessed with skill inside a Tableau dashboard. Take this one simple example. This dashboard embeds a ‘hyperlink’ to signal to the user that he/she can click to select more specific information. Instead of throwing everything inside one container, the design lightens the cognitive load and encourages the user to explore, which leads me to my final point: Business Intelligence.
‘When people have the ability to finish a nearly complete idea themselves, the success of the idea not only is more likely—it often becomes inevitable.’ – Will Wright
This, really, is the intelligence in ‘Business Intelligence’ for one simple reason: when the user can leverage their own exploratory mind when interacting with a dashboard, their answers (and follow-up questions) can have enormous power. Designing a user experience with Tableau is not a linear process. Data is not a linear process. Data is chaos (in a good way). Data is today’s currency. This type of analysis, therefore, begs a ‘systems thinking’ approach.
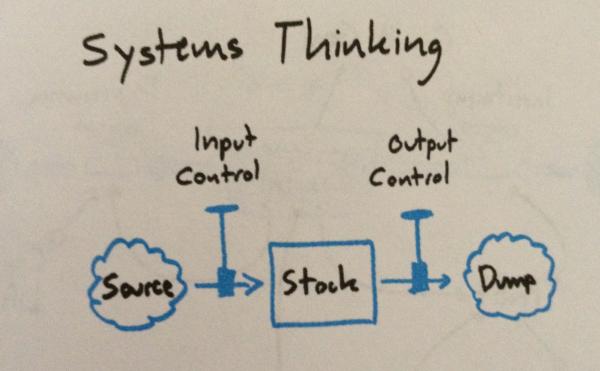
Thanks to Dan Roam for such a simple, yet powerful, picture and Donella Meadows for the model of systems thinking, termed the ‘bathtub model’ of systems dynamics. ‘We can look at any complex system as a ‘stock’ (the bathtub) with an inflow (the spigot) and an outflow (the drain). The essential resources needed to fill the stock…originate from some source, pass into the tub for some use, and eventually drain out into some dump’ (Roam, 2011). One can see its usefulness to BI since it, also, is a complex system, demanding data from any number of sources (which can then turn into yet another source for the system). BI professionals fill their stock with data and control inputs / outputs via Tableau to tame an otherwise insane amount of data. The human mind can only handle so much; to believe otherwise is, quite simply, insane.
As change agents in a New Age of Data, Tableau designers, BI Engineers will do well to remember that our life is a ‘systems thinking’ life. Nowhere is that more evident that our present culture of data abundance.