George Santayana once said that “those who cannot remember the past are condemned to repeat it.” Every history professor I had from high school through college repeated some variation of that phrase. At one point, I hated history. I could not force myself to memorize dates and names; it didn’t come as easily as math and science.
According to Lyceum Books, “there are four primary learning styles, visual, auditory, read-write, and kinesthetic.” I fell into the kinesthetic group, meaning I had to do an exercise or activity before I understood it. I needed to be able to interact with the data.
Tableau as a Teaching Aide
It’s safe to say there are many others out there like me who need that interaction to learn. So, I thought that by using Tableau as a learning aide we would be able to reach a group of learners who struggle with the normal textbook and video options we grew up with. This was the foundation for “The History Lesson – WWII,” demonstrating how Tableau can be used as something other than just a business tool.
Collecting the Data
After some time spent researching information on WWII, I was able to build a data set that I then used for our History dashboard. This data set included information such as battle names, the commanding officers of each battle, casualties, locations and dates. I obtained all of this data from the “semi-reliable” Wikipedia and searches on other history sites. Once I felt like I had an adequate list of battles and the rest of the necessary information, the worksheet building commenced.
Building the Viz
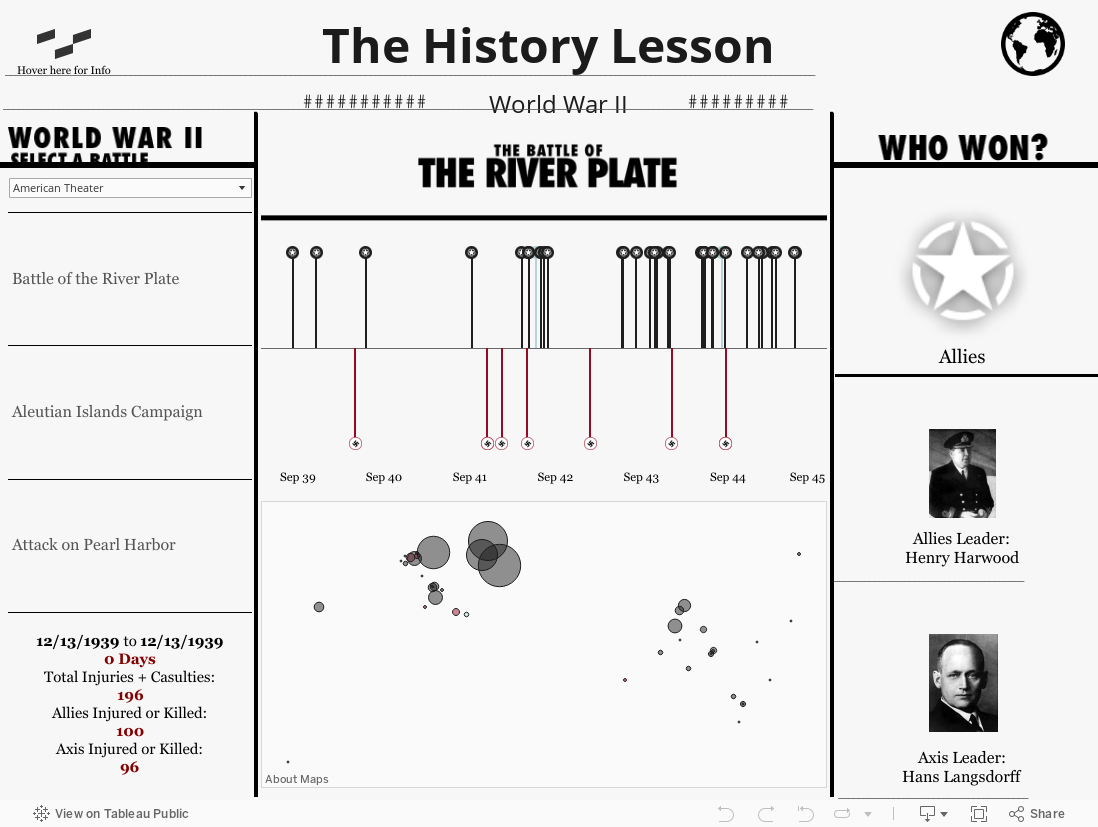
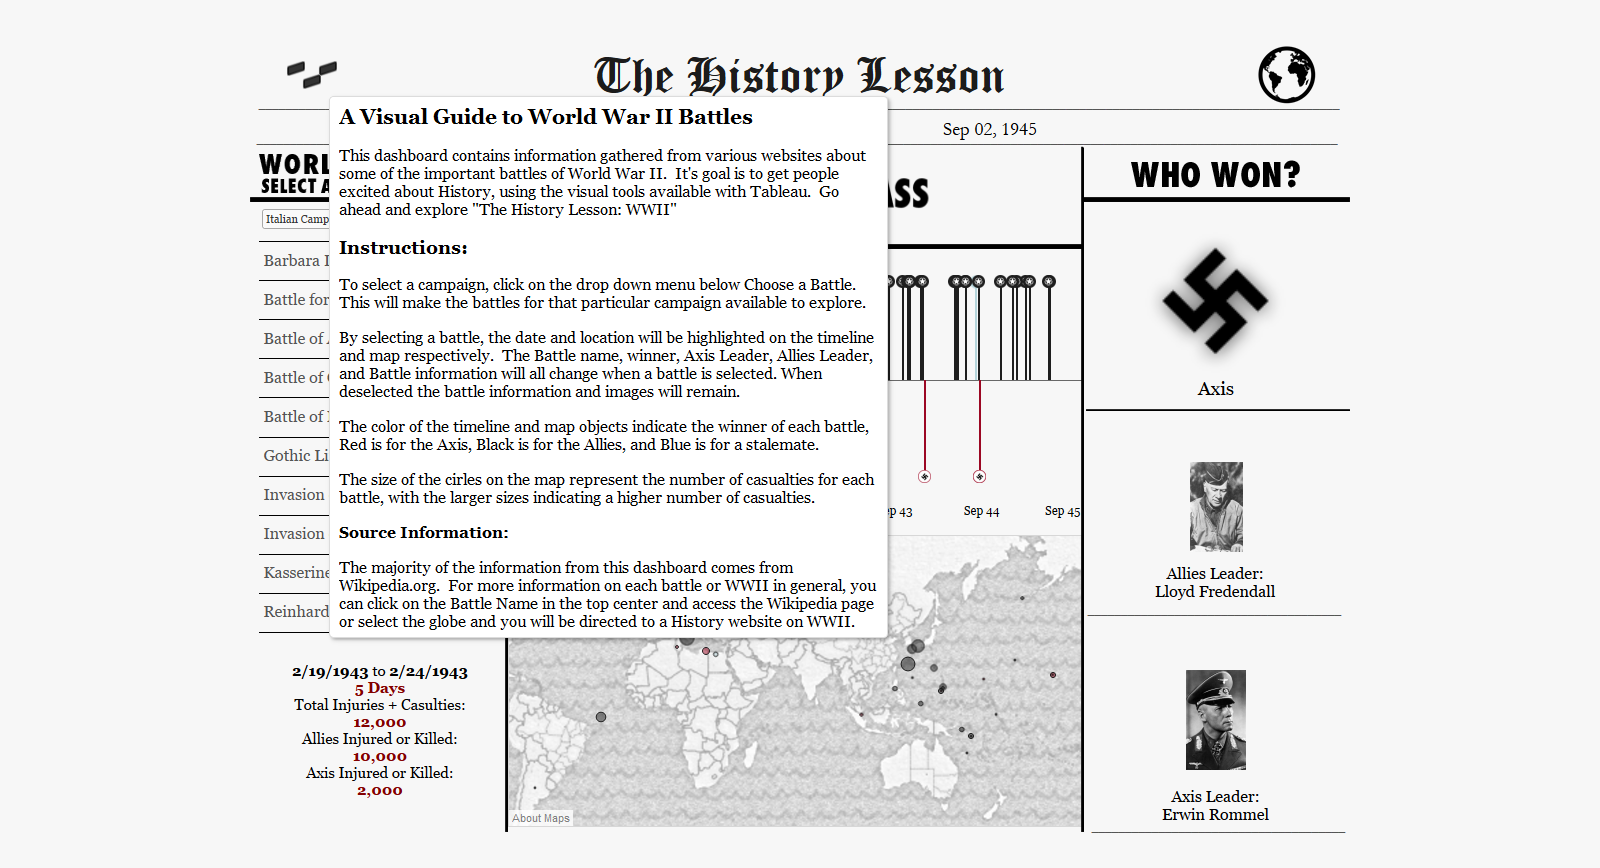
I knew that there were a few things students would be interested in right away, namely the timeline and maps. Beyond that, I needed to figure out a way to build an interactive dashboard that still gave the user important information. Information about how to interact with the dashboard is available by hovering over the InterWorks icon in the top-left corner of the dashboard.
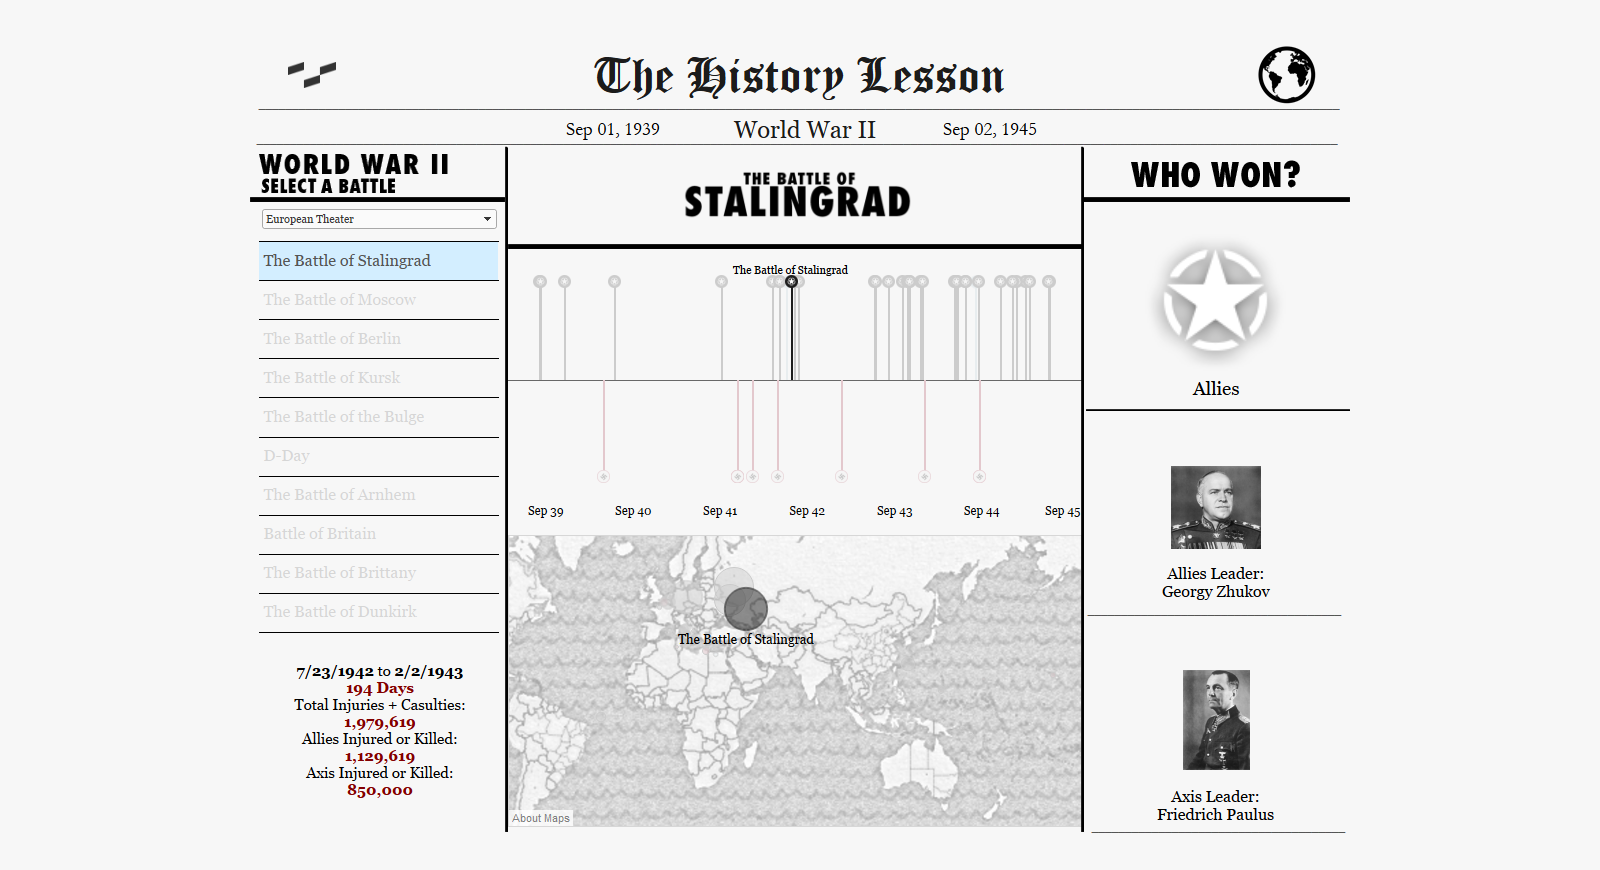
By selecting a battle on the left side of the dashboard, the user will then see the point on the timeline and map highlighted as well as the commanding officers and winners listed on the right. Some basic battle info was provided on the bottom left-as well.
Enjoy your interactive journey through World War II: